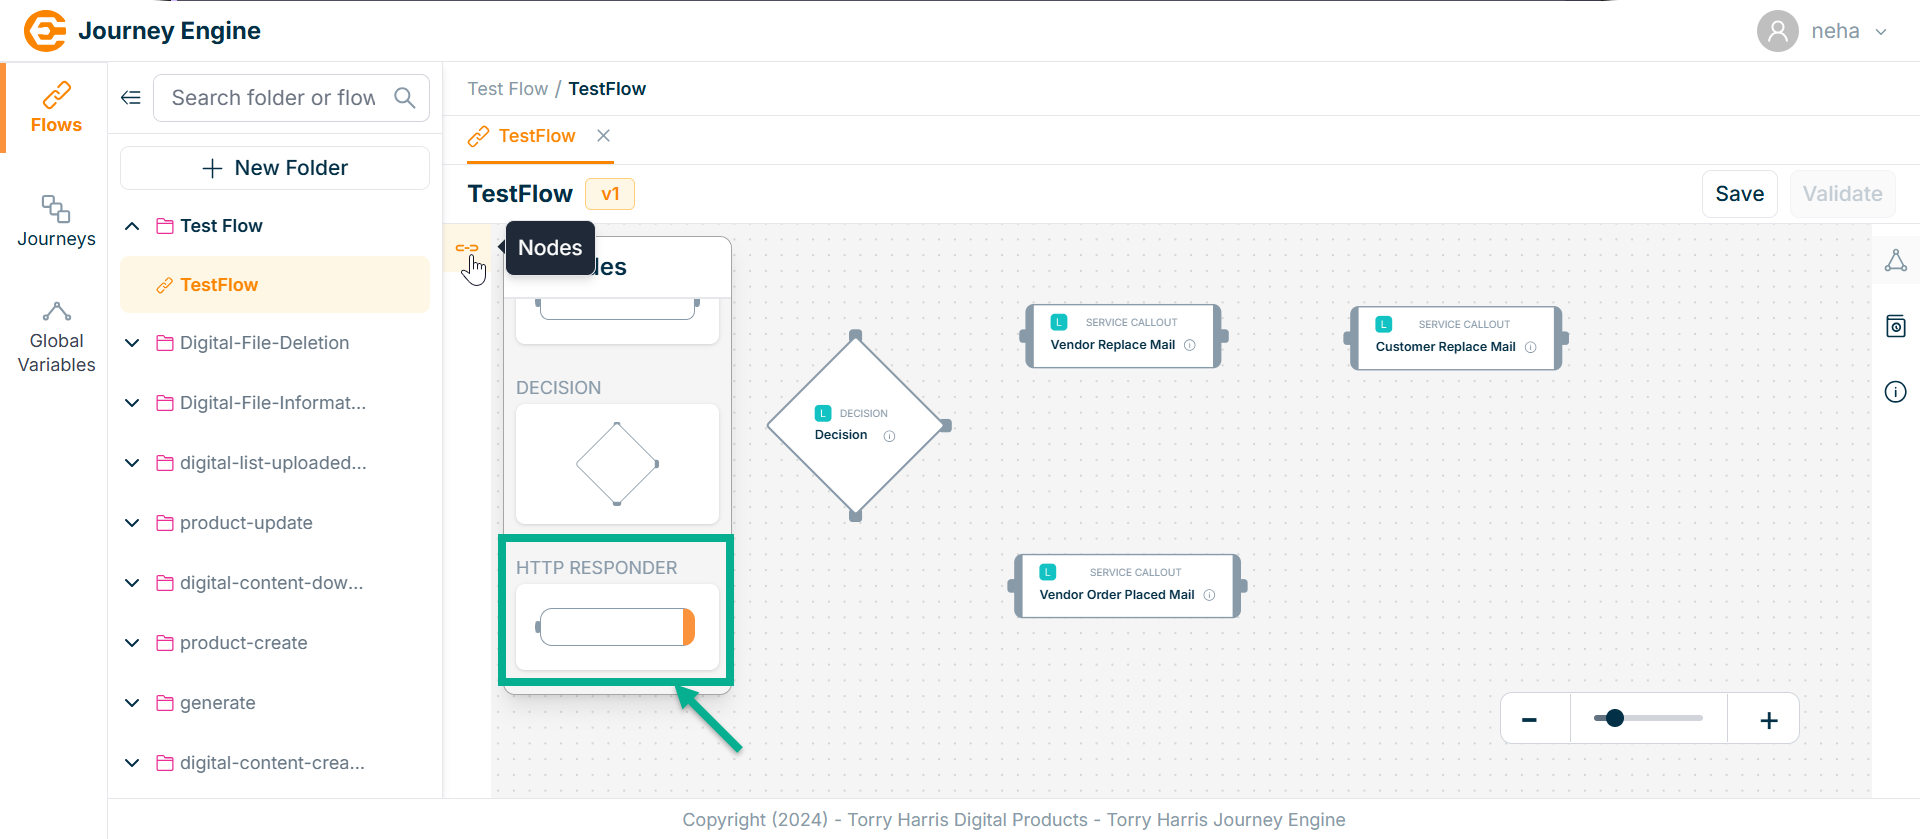
Flow Nodes
Nodes are steps in a process that do specific tasks, like making decisions. They help run business workflows smoothly and automatically.
There are 4 Nodes to create the Flow:
- HTTP Listener
- Service Callout
- Decision
- HTTP Responser
HTTP Listener Node
The HTTP Listener node is the first node in an API flow that waits for incoming HTTP requests and then initiates the defined business logic or data flow.
- Click on HTTP Listener node from the canvas.
Canvas is the middle panel where users can drag and drop the required Nodes for constructing the flow.
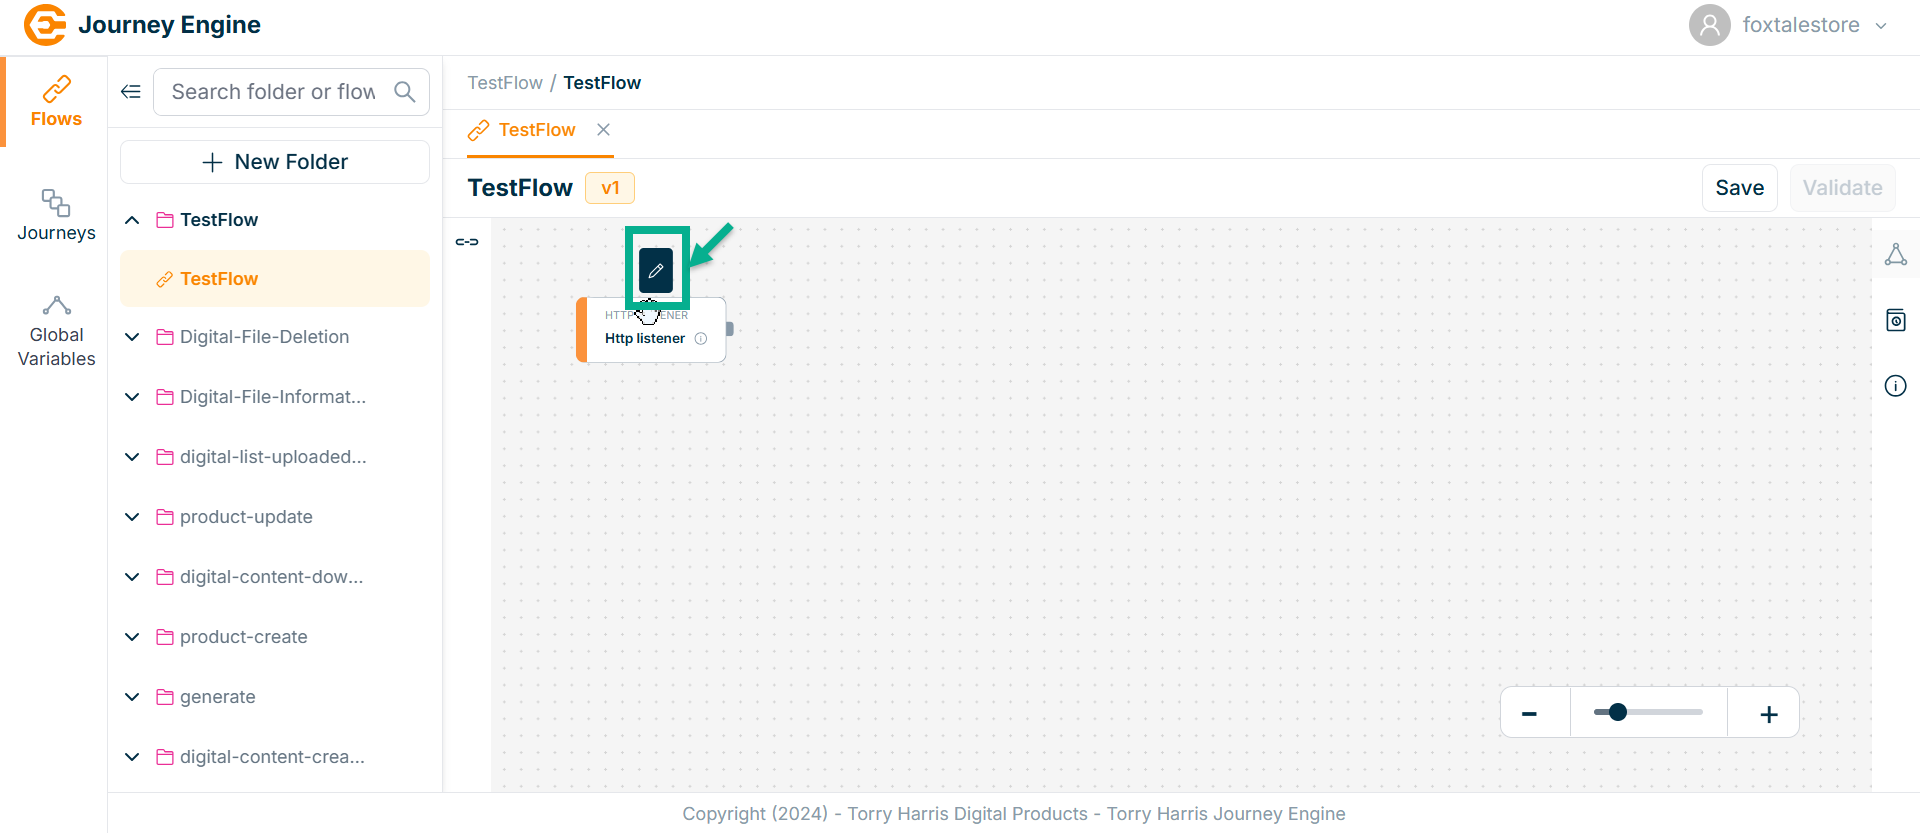
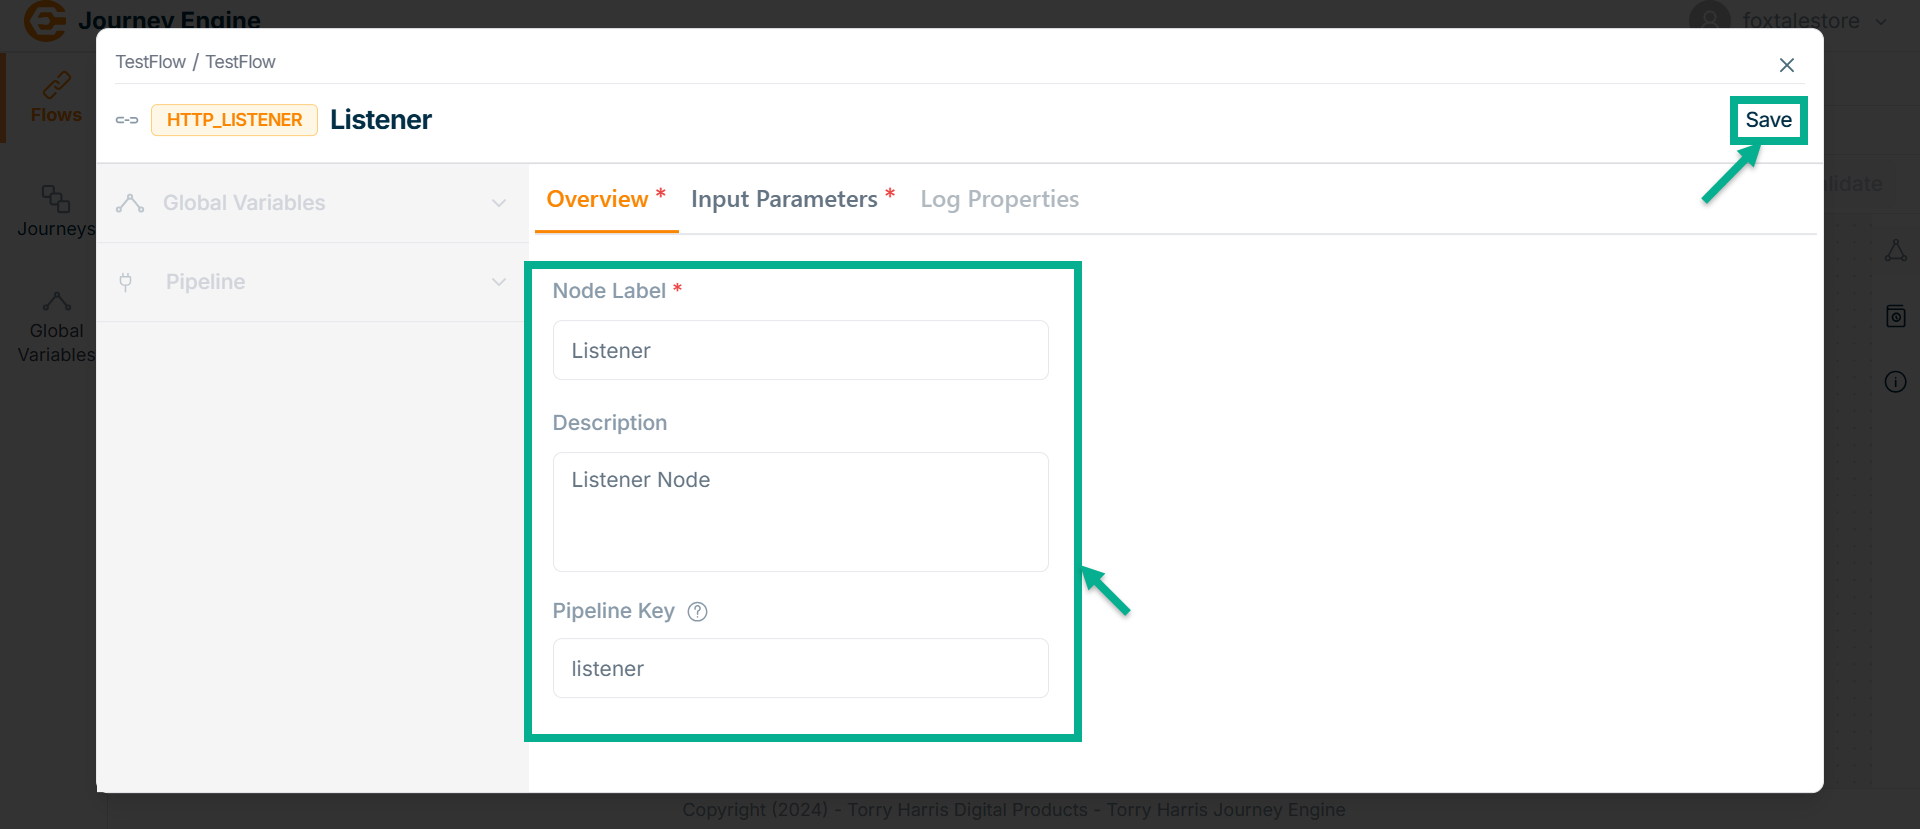
The HTTP Listener screen apperas as shown below
-
Enter Node Label and Description.
-
Enter Pipeline Key.
Pipeline Key selects when the output of one element is the input of the next one.
Pipeline Key is used to retrieve all API-related data necessary for the operation of a workflow. It then passes this data to any of the nodes in the pipeline, enabling seamless communication and data sharing across the workflow.
-
Click Save.
-
Go to Input Parameter.
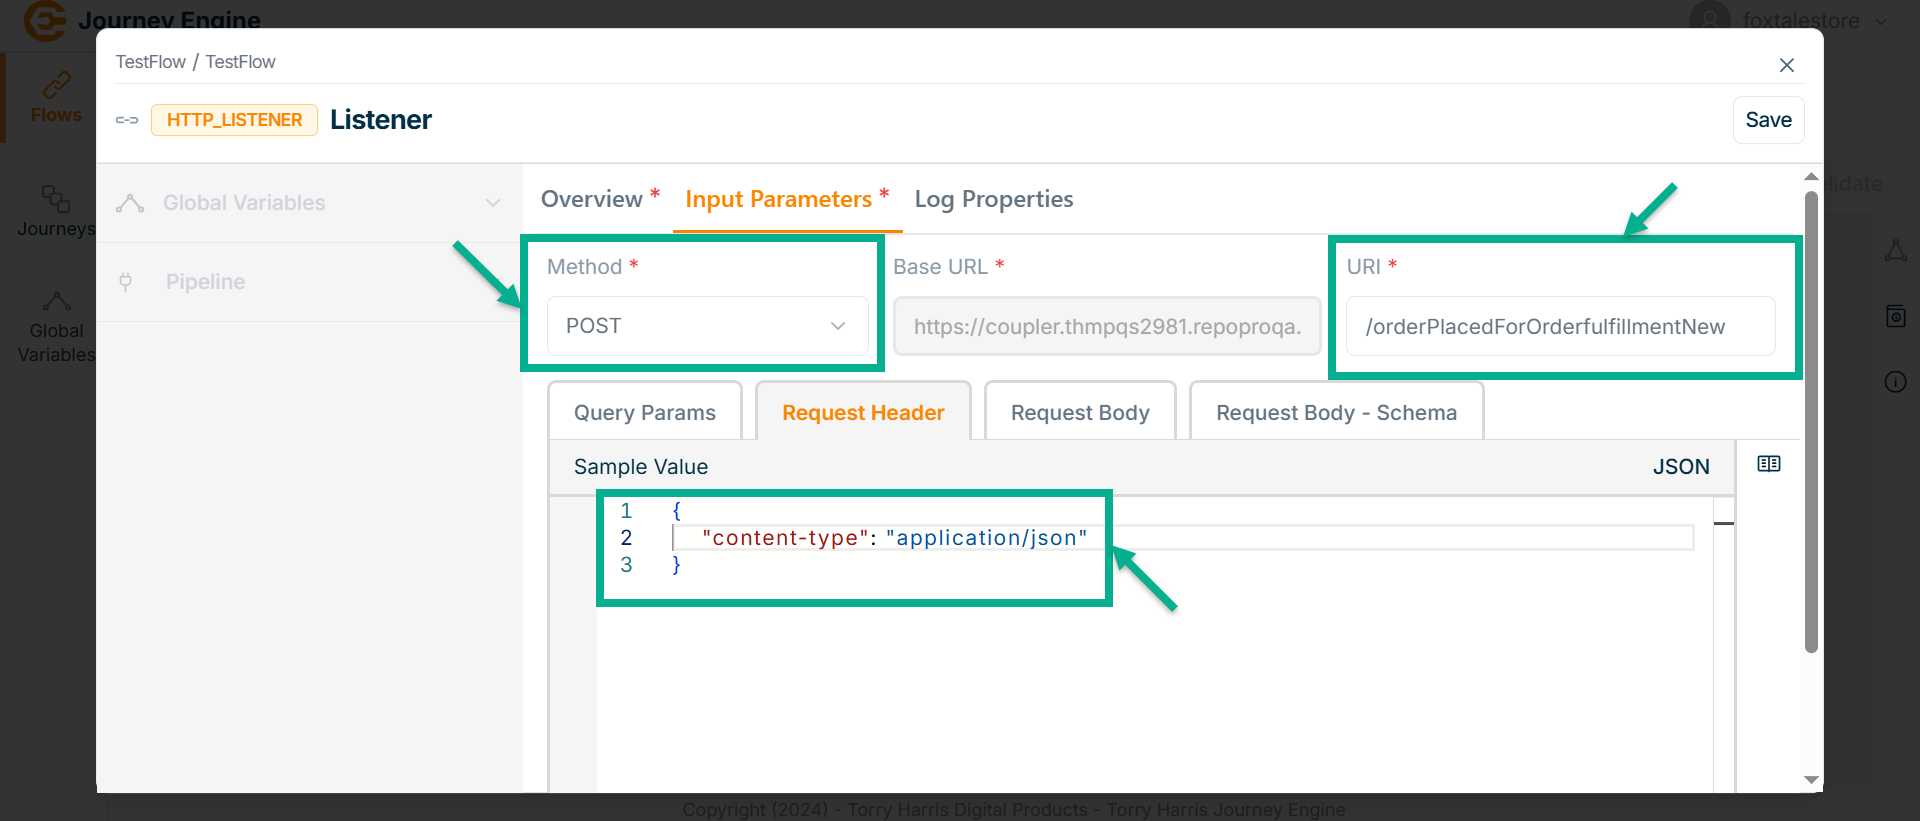
The Input Parameter screen apperas as shown below
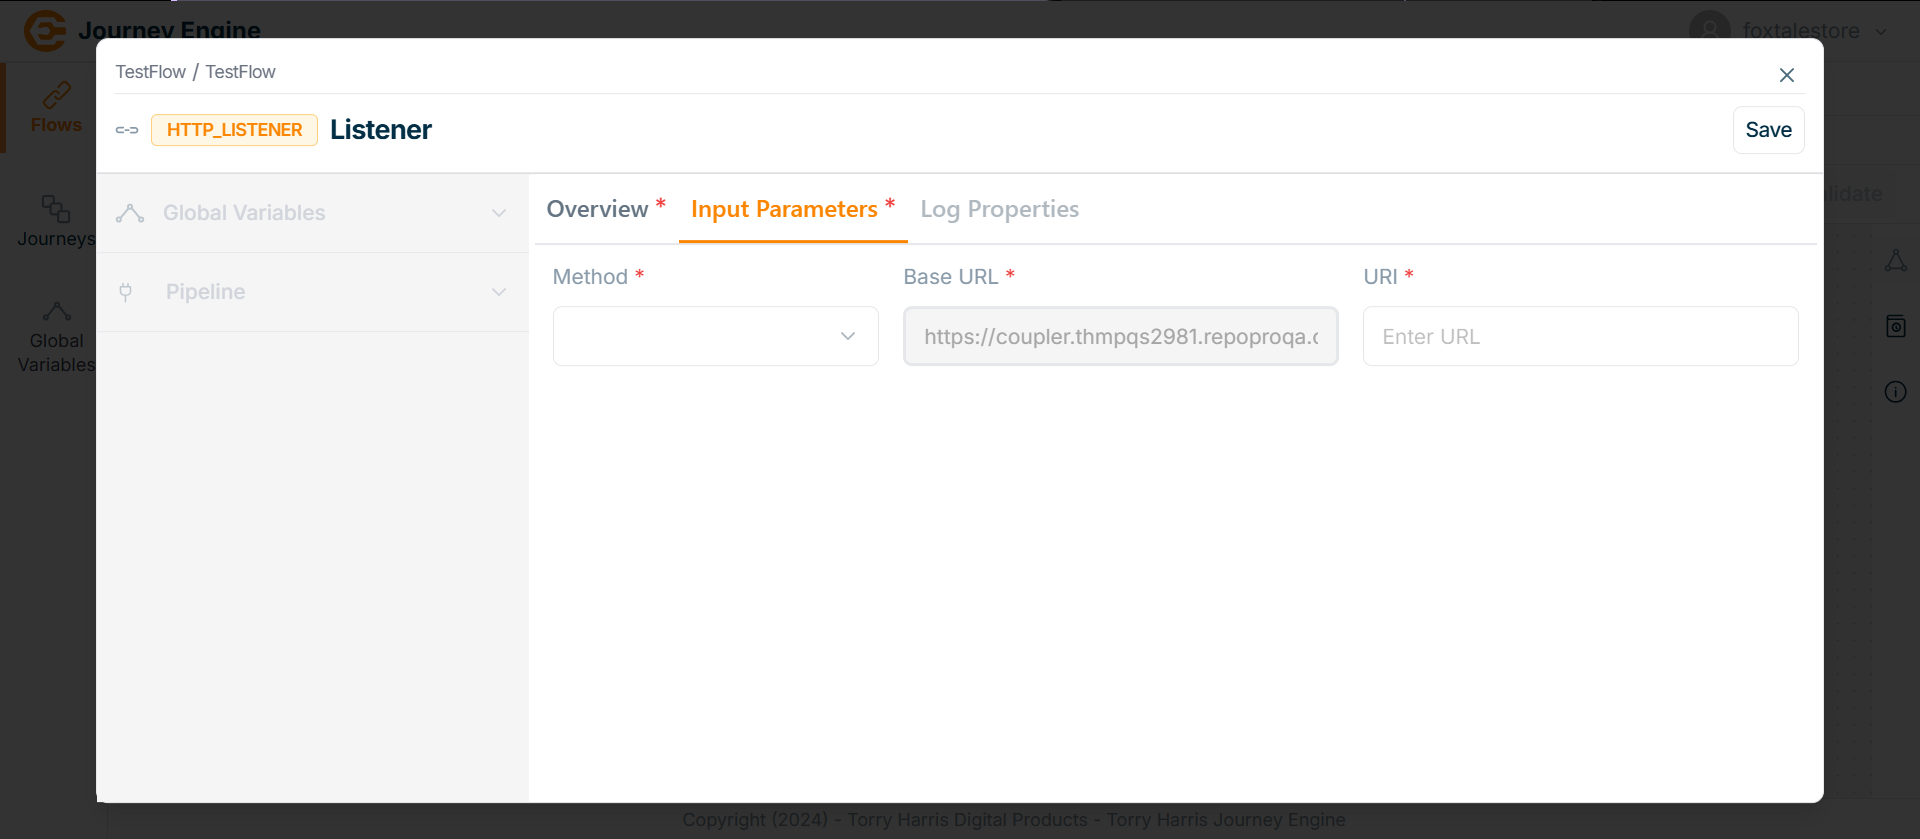
- Click on Methods field.
The Methods dropdown is shown as below.
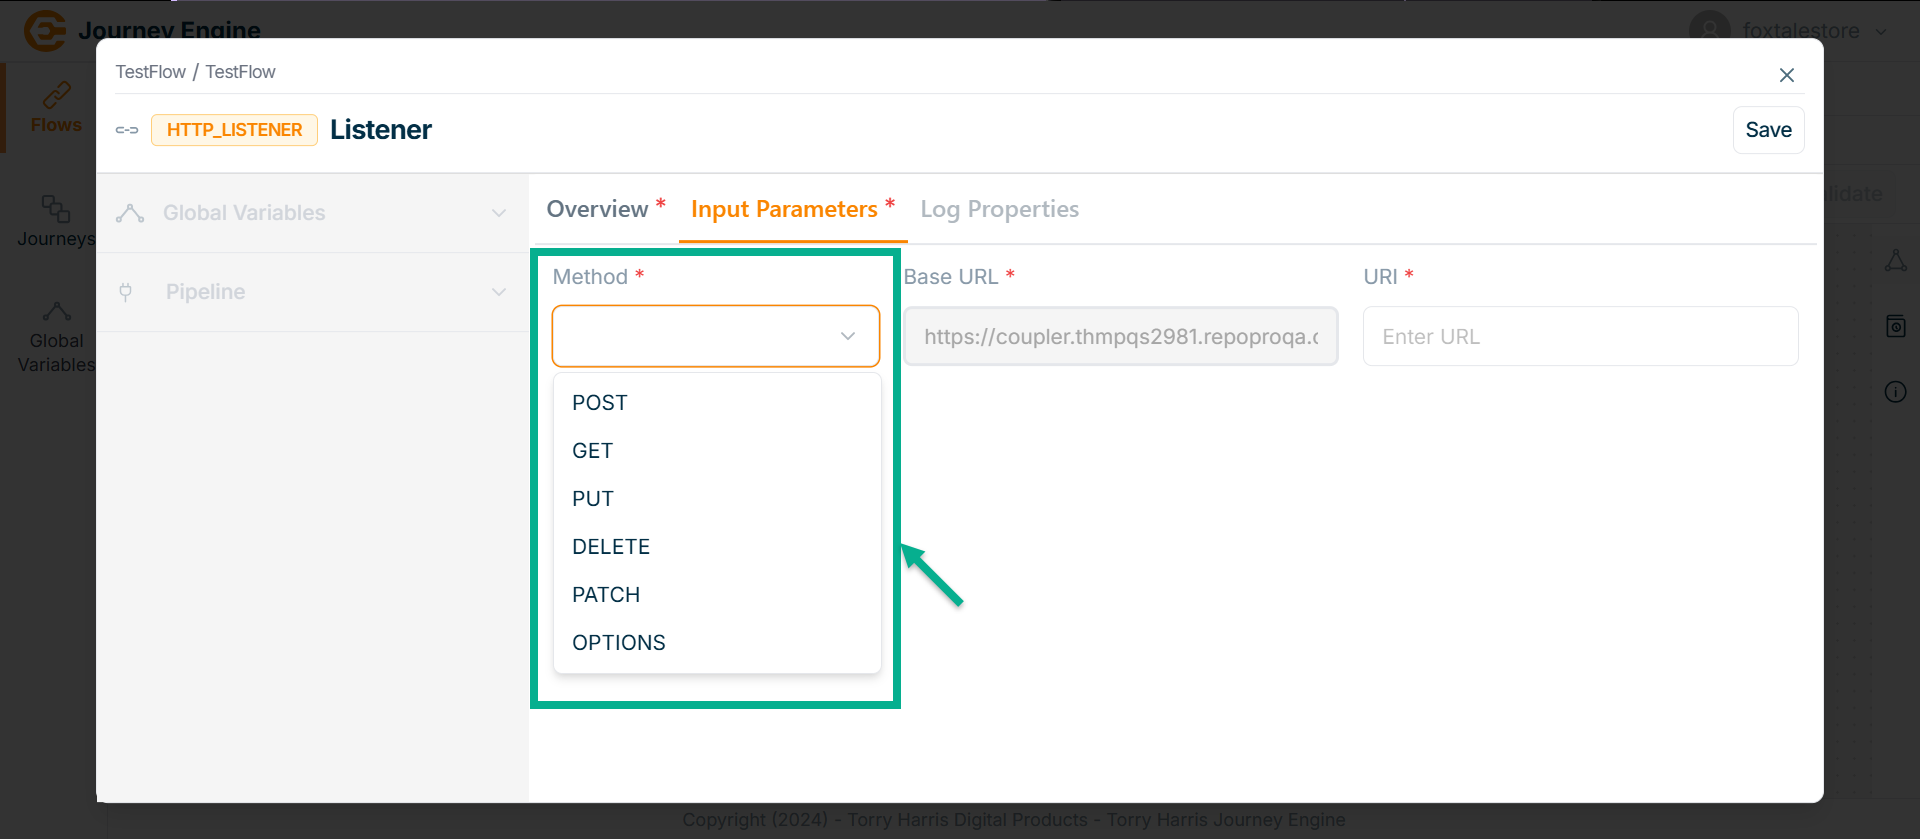
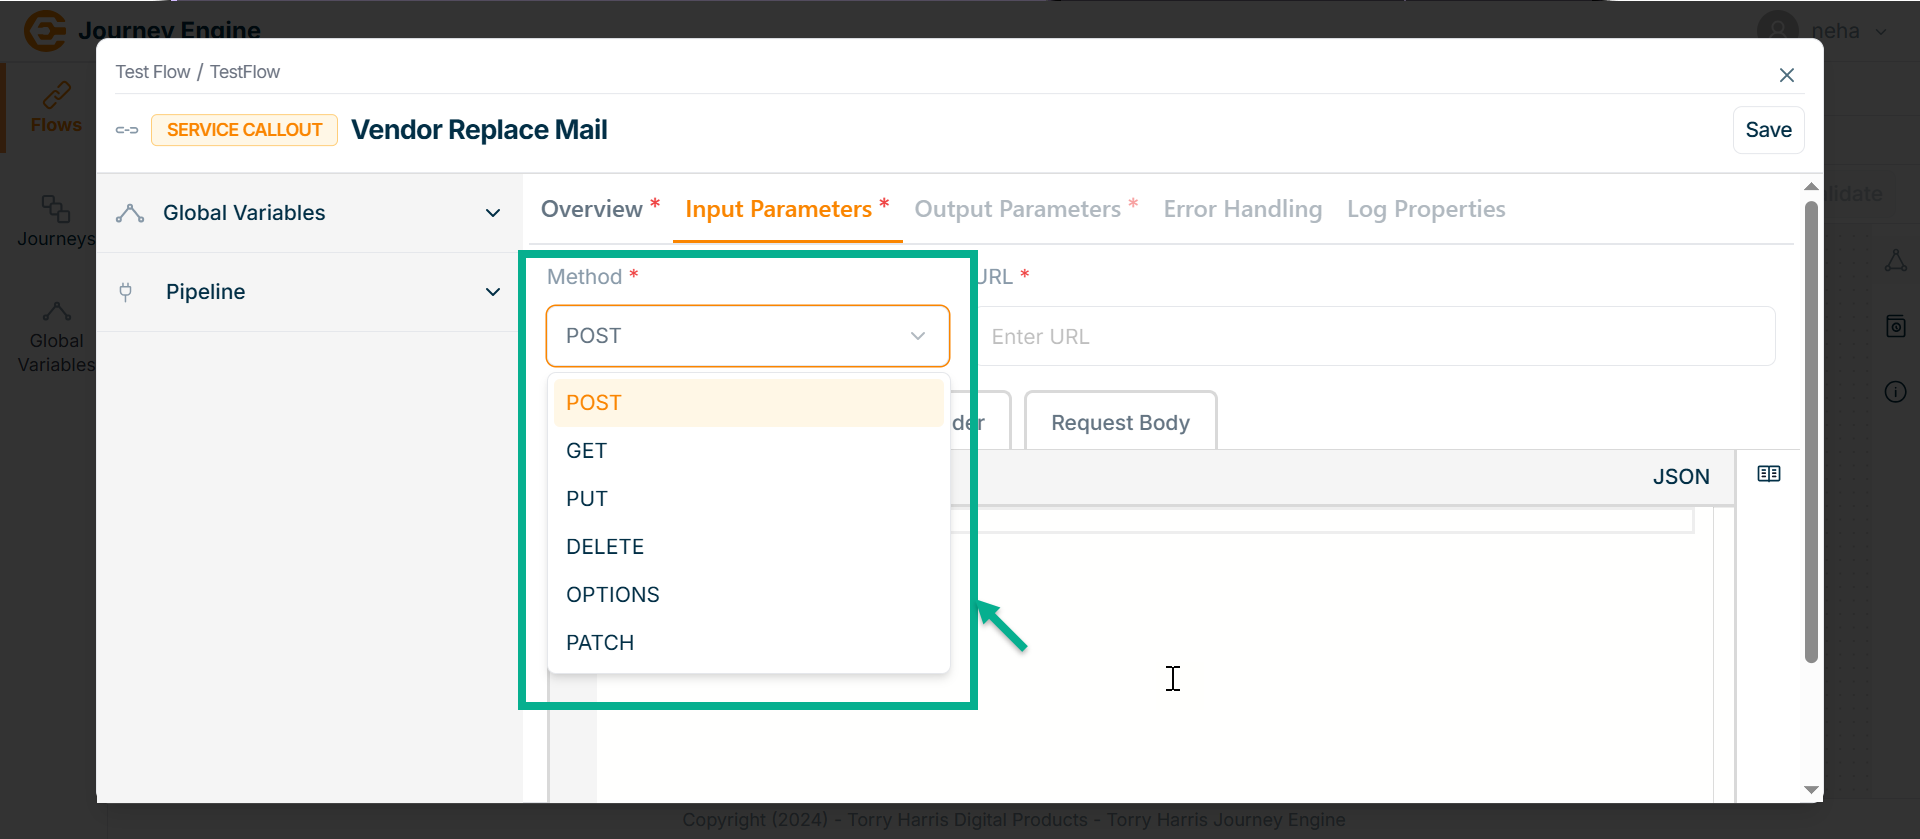
The HTTP Listener node supports various HTTP methods including POST, GET, PUT, DELETE, PATCH, and OPTIONS allowing it to handle a wide range of request types for different business operations such as data retrieval, updates, and deletions.
- Select the Method. Here taking the example of POST Method.
Base URL is fundamental preconfigured part of Flows or Journey's endpoint.
- Enter URI.
- Under Query Params tab enter the value in JSON format if required.
Query Parameters: Set of parameters attached at the end of an URL. They are extensions of the URL that help to define specific content or actions based on the data being passed. It is always as Key and Value pair. It is specified by selecting any Source and Value must be JSON.
Request Header: The header lines set in the request. It can be used to set various parameters like content-type, accept type etc.
Request Body: The data sent to call an API.
-
Go to Request Header tab.
-
Enter Value in JSON format.
-
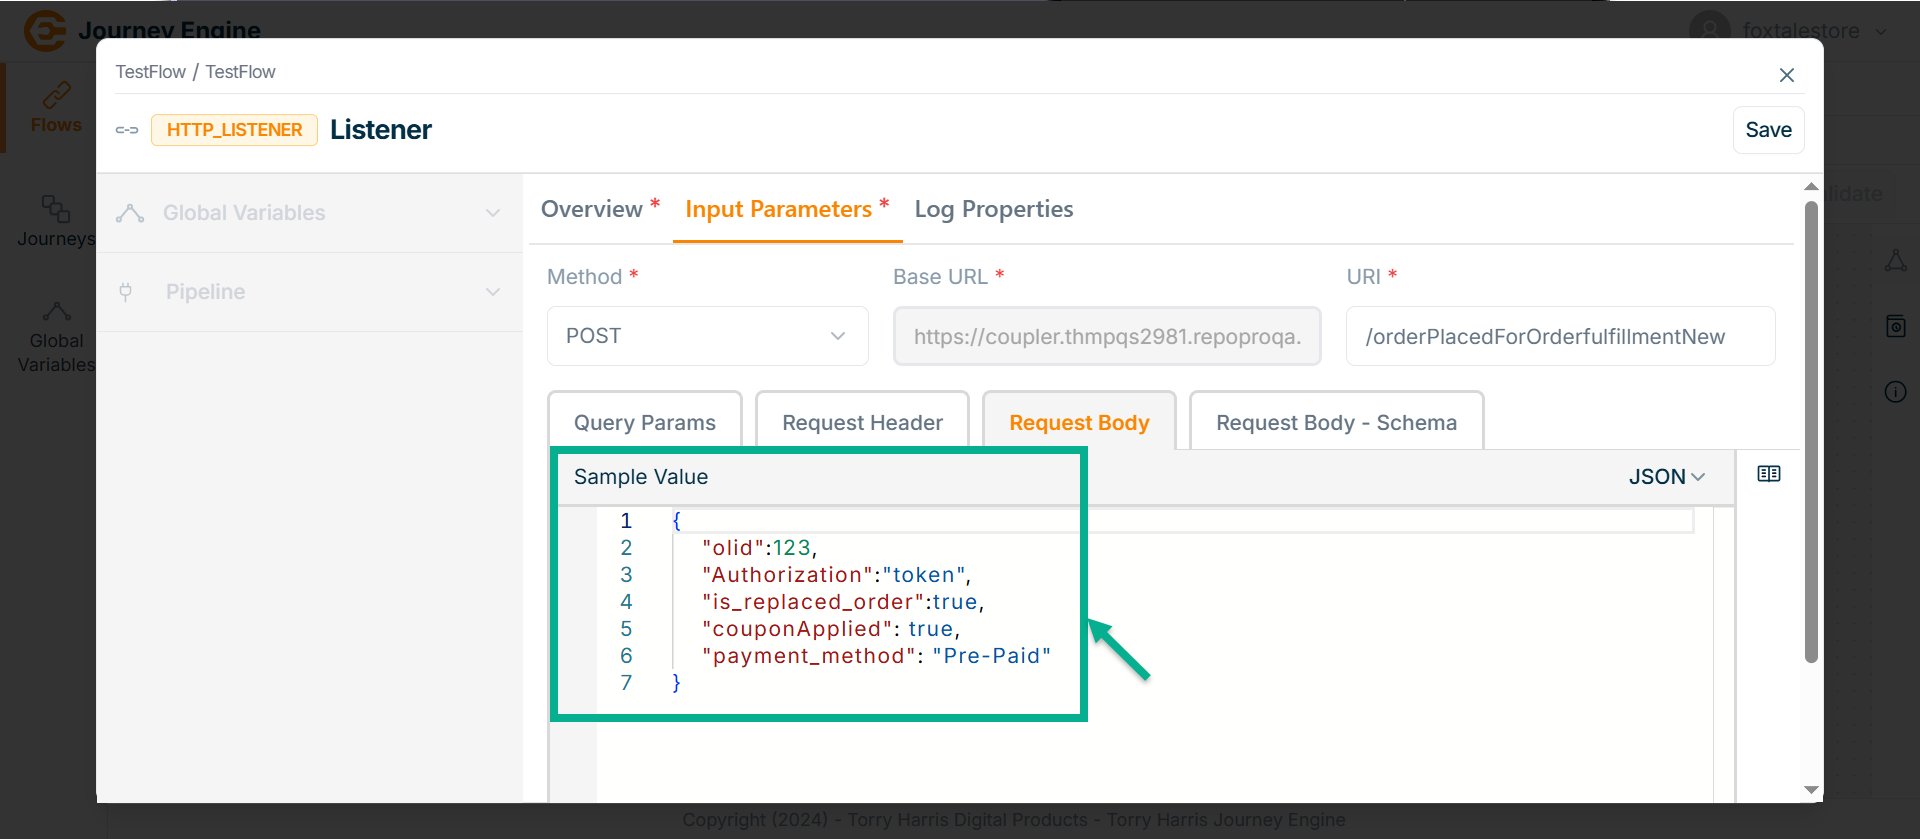
Go to Request Body tab.
-
Enter Value in JSON format.
- Go to Request Body - Schema tab.
The Request Body Schema is a JSON Schema that automatically generates based on the request body structure. It helps ensure that the incoming data matches the expected format, while providing users with a straightforward way to validate and enforce data consistency.
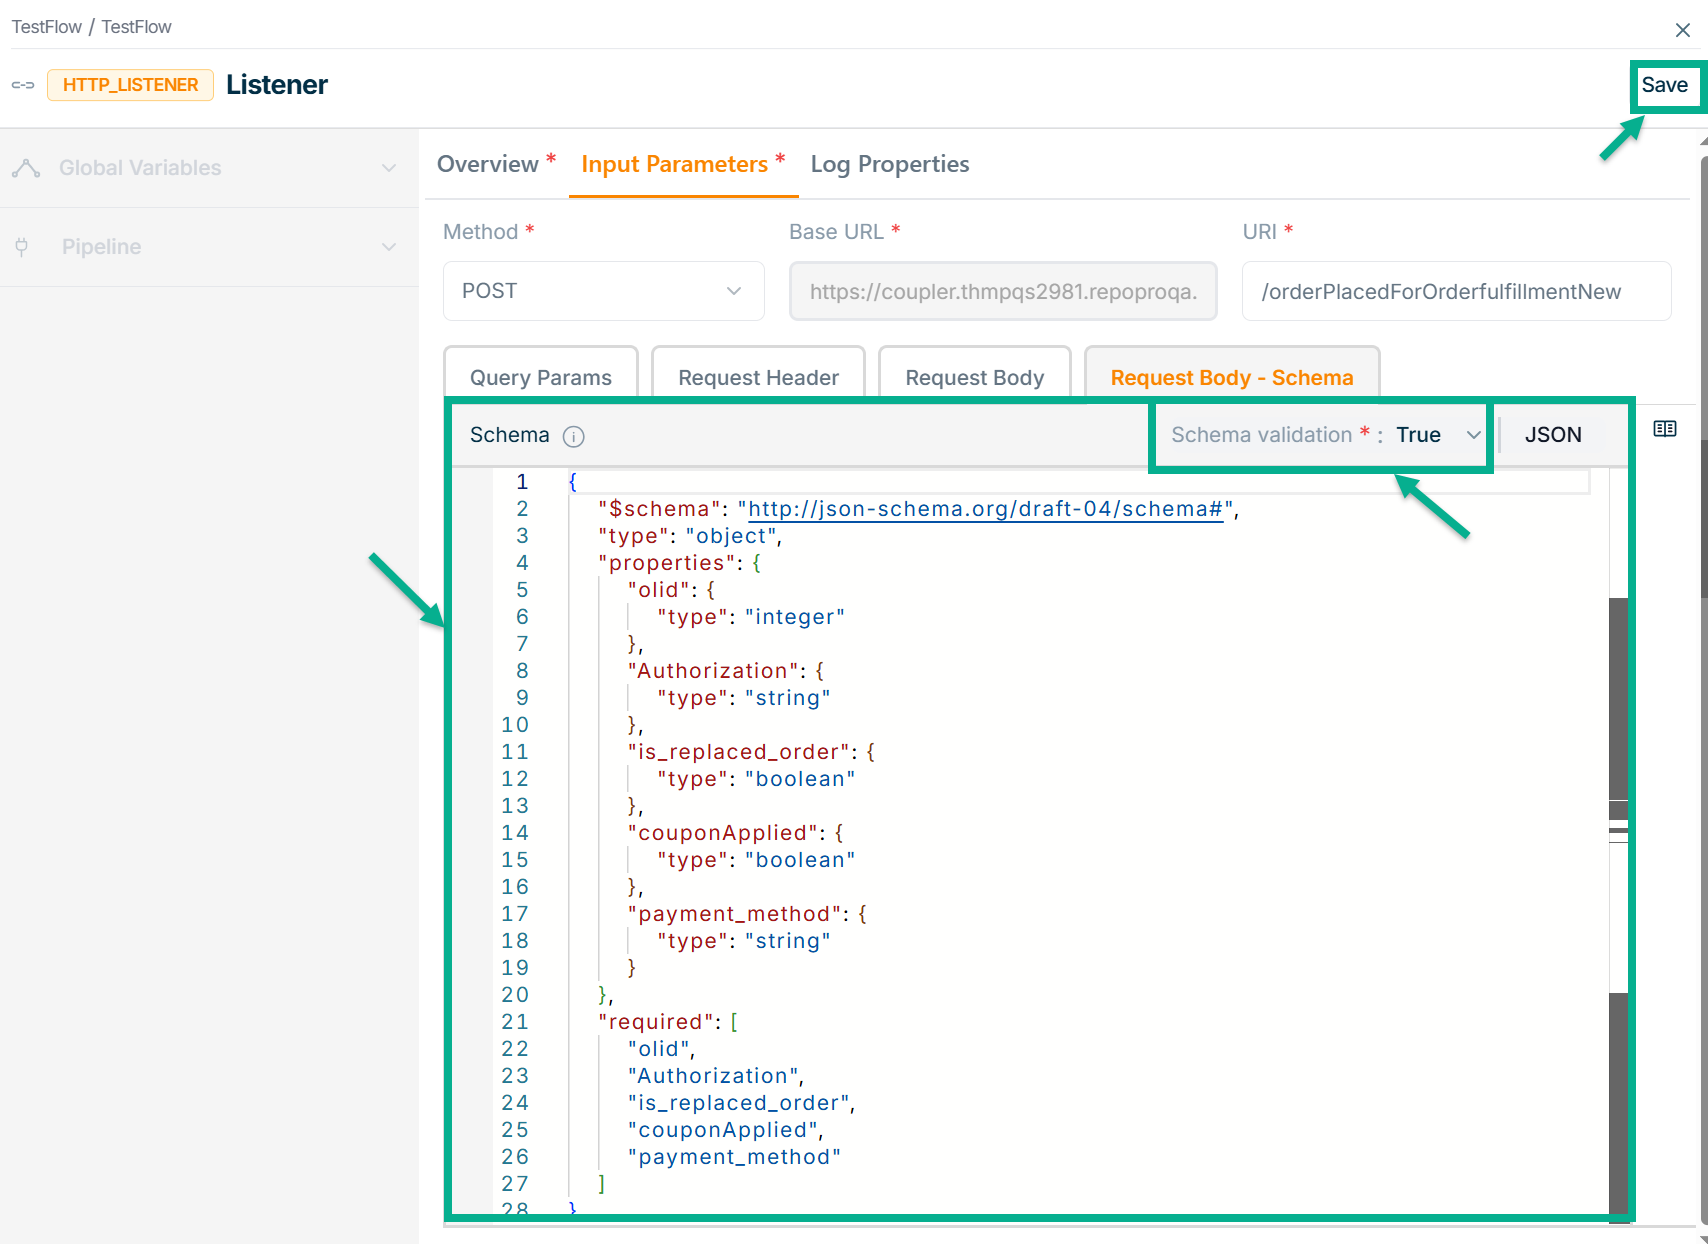
-
Select the Schema validation as True or False indicating whether the schema is valid or not.
-
Click on Save.
-
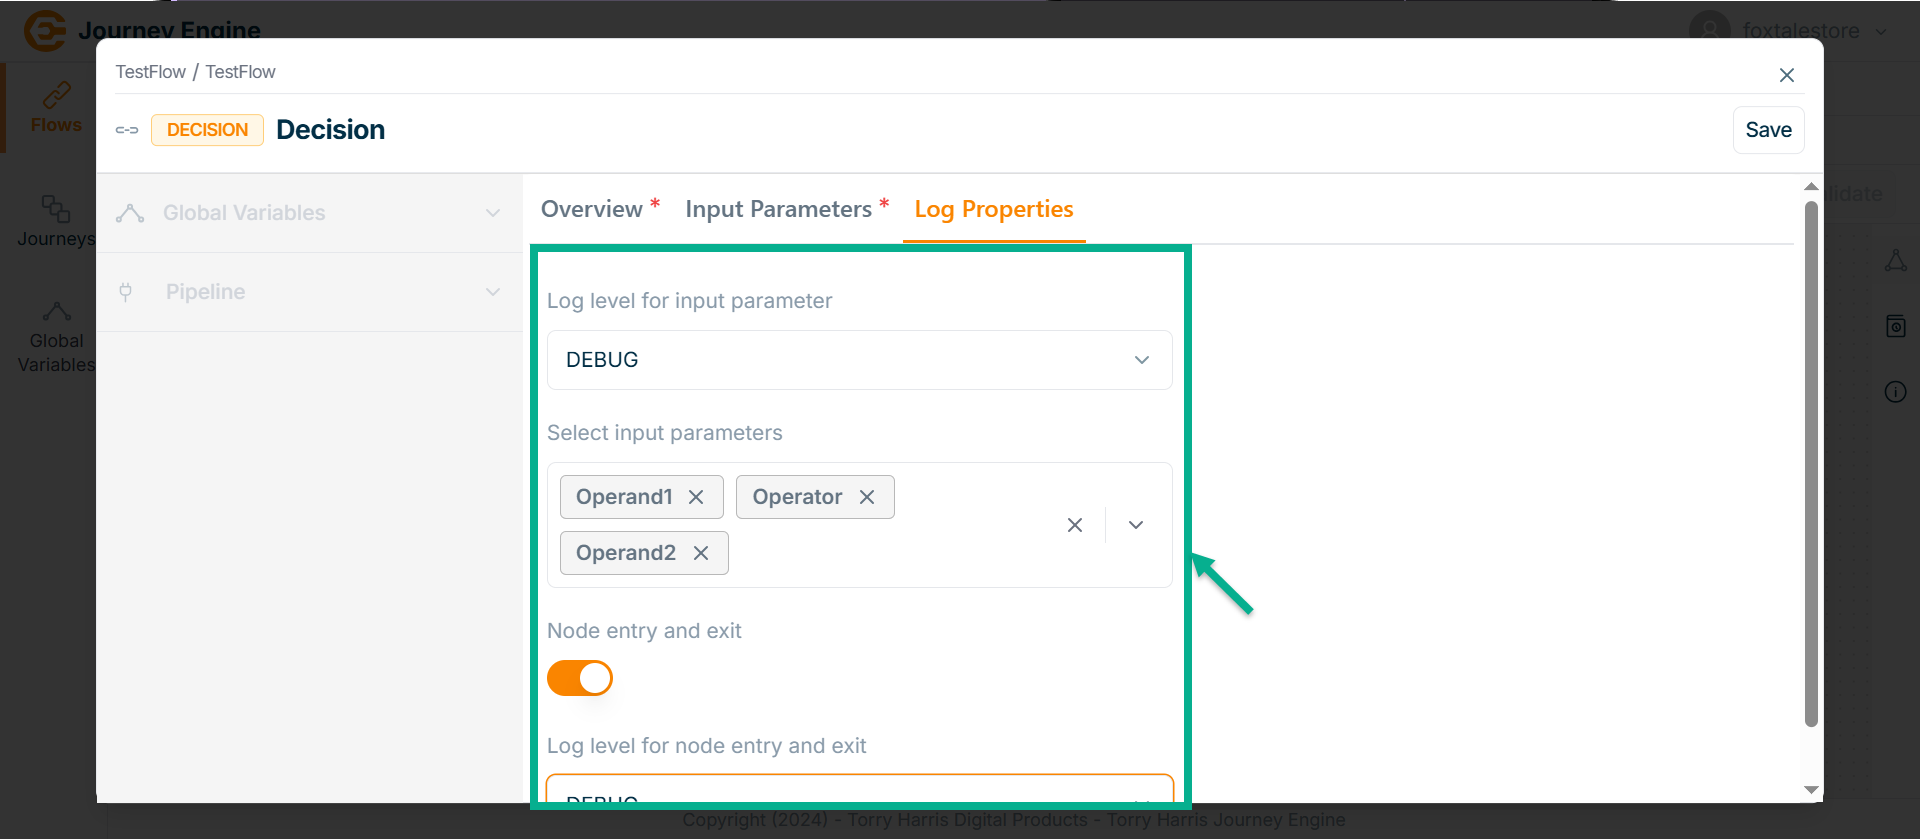
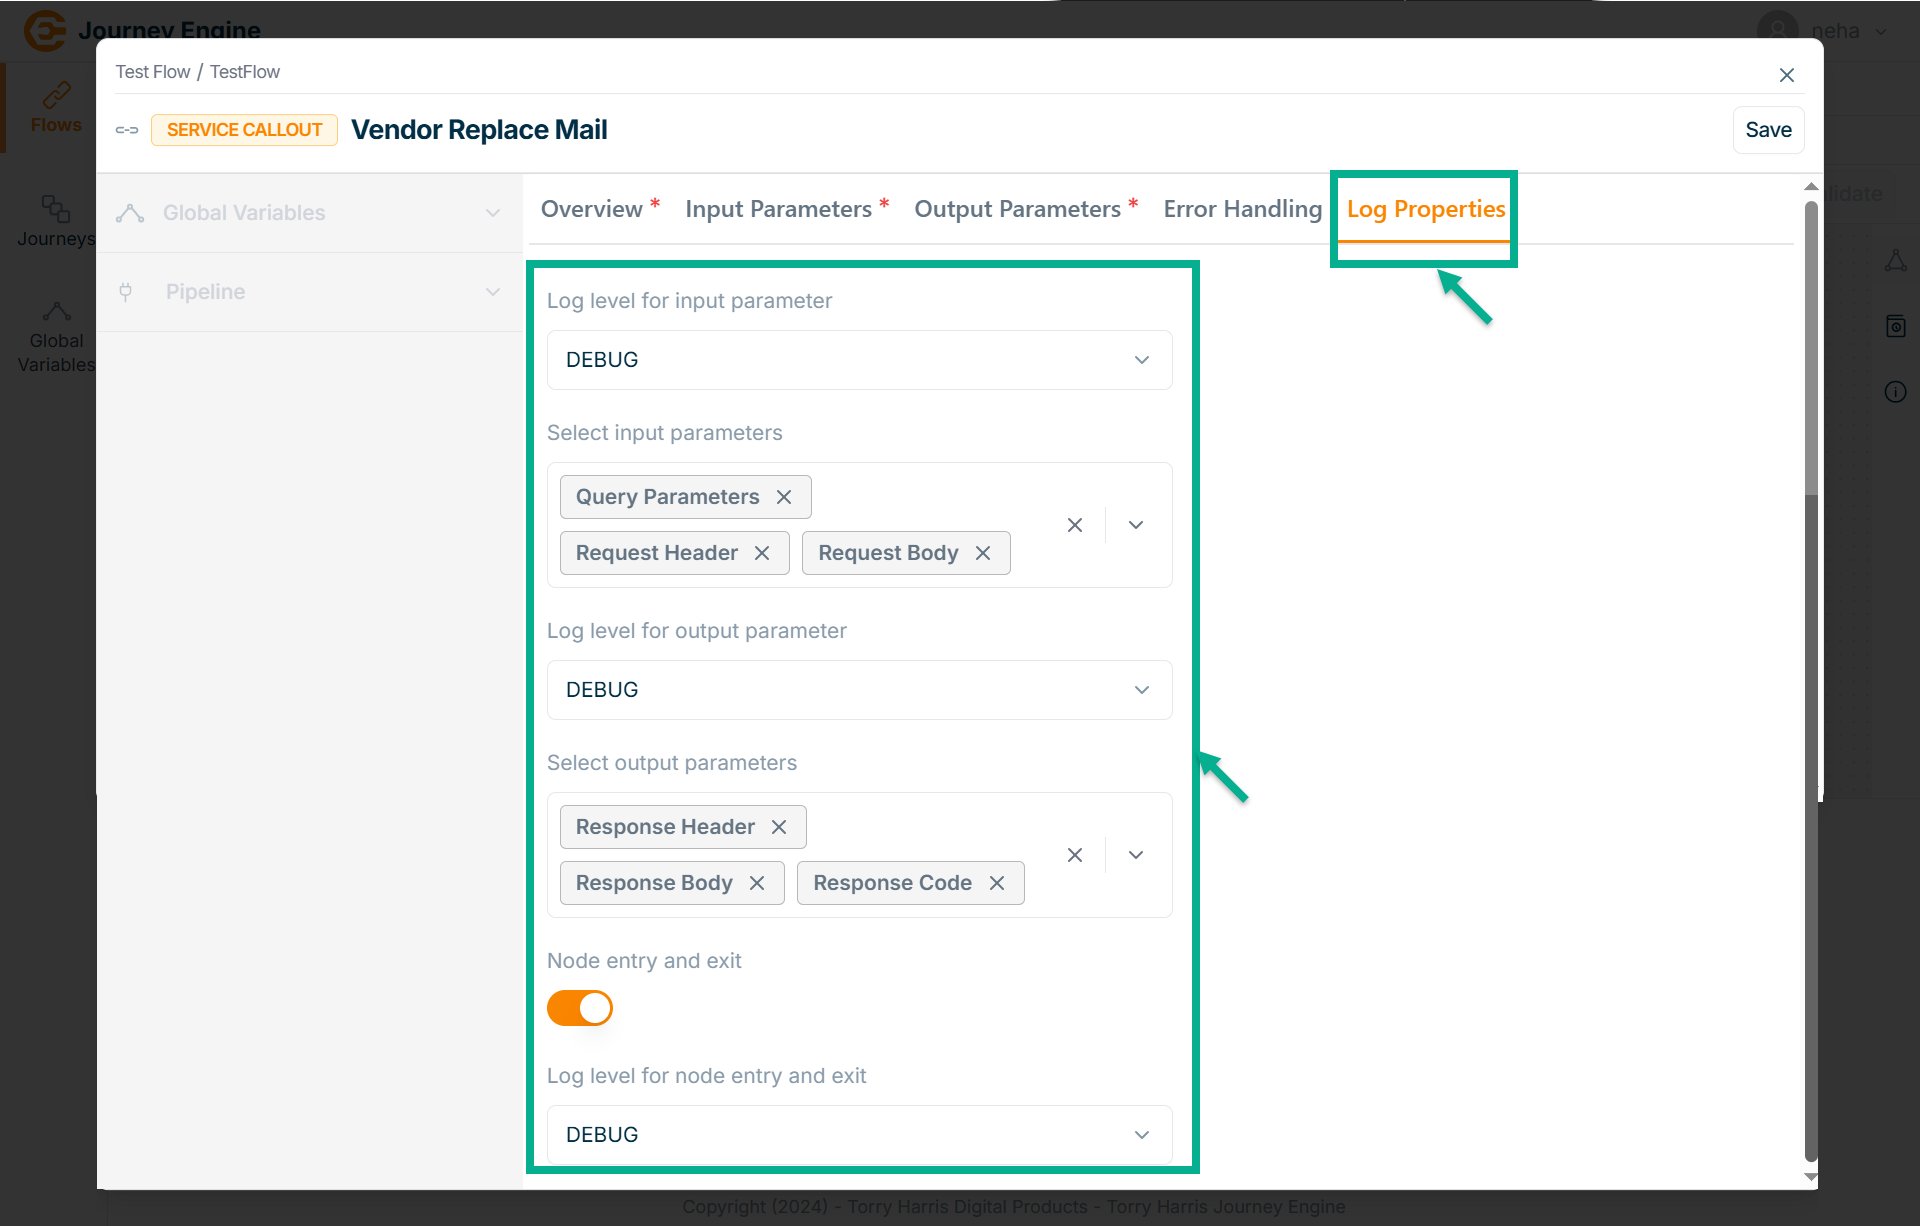
Go to Log Properties.
Log Properties define structured, meaningful log messages with appropriate log levels to track system activity across environments like Dev, QA, and Prod. These properties help in filtering, analyzing, and transforming logs for debugging, monitoring, and even influencing business decisions.
The Log Properties screen apperas as shown below.
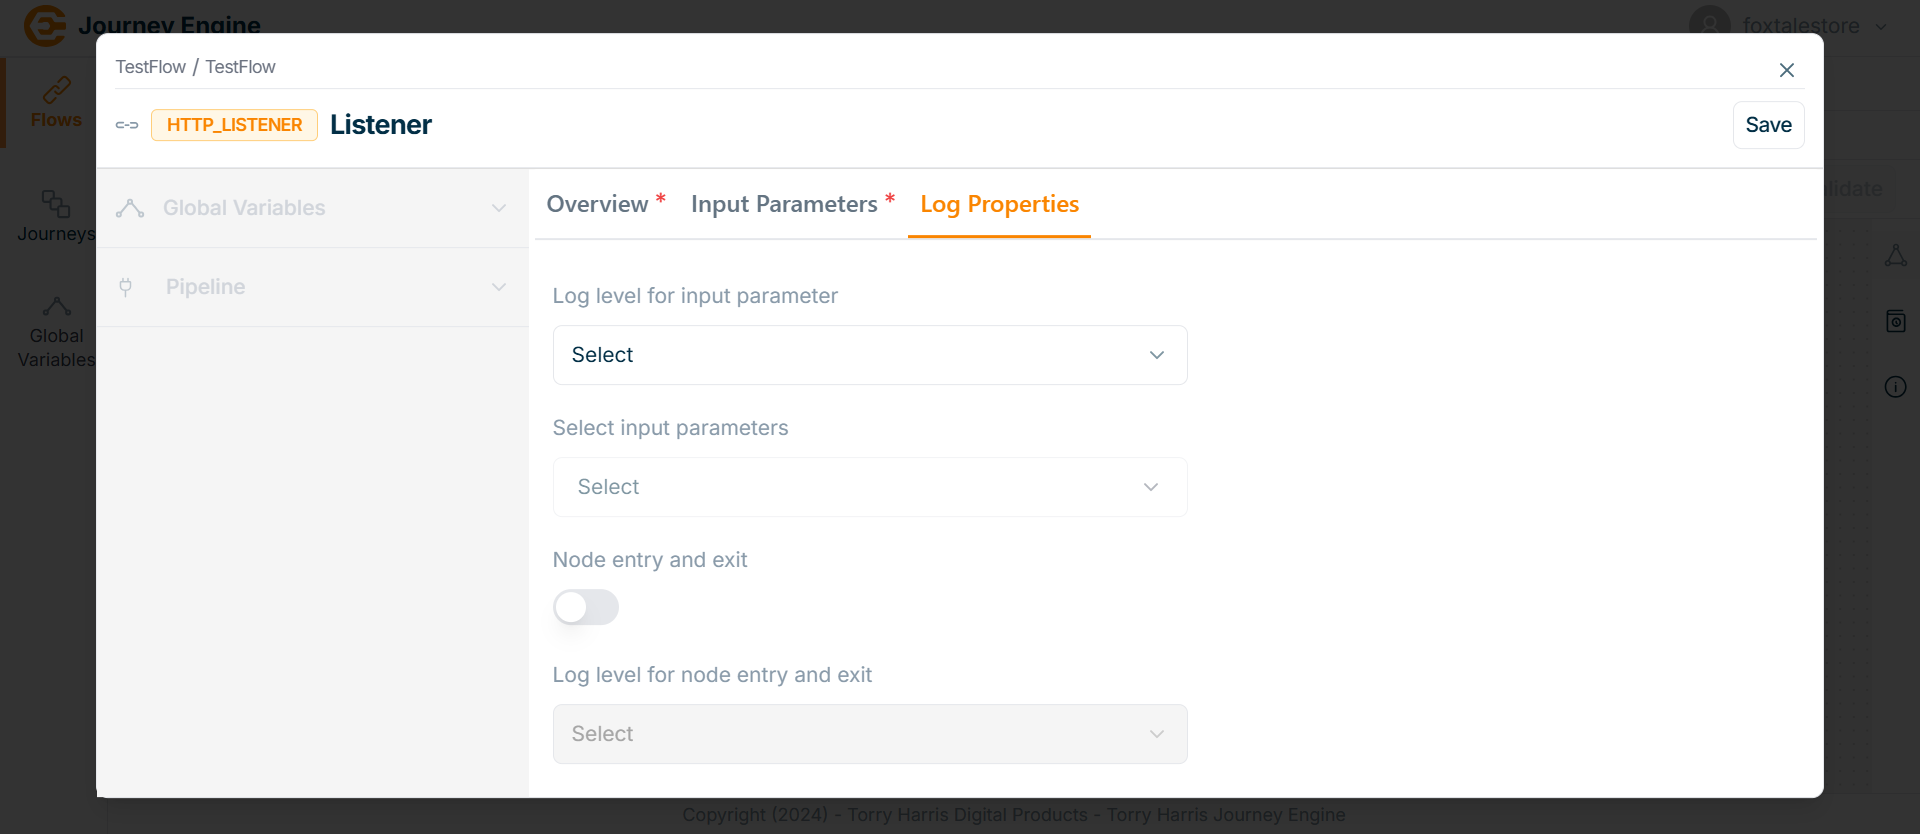
- Click on Log level for input parameter dropdown.
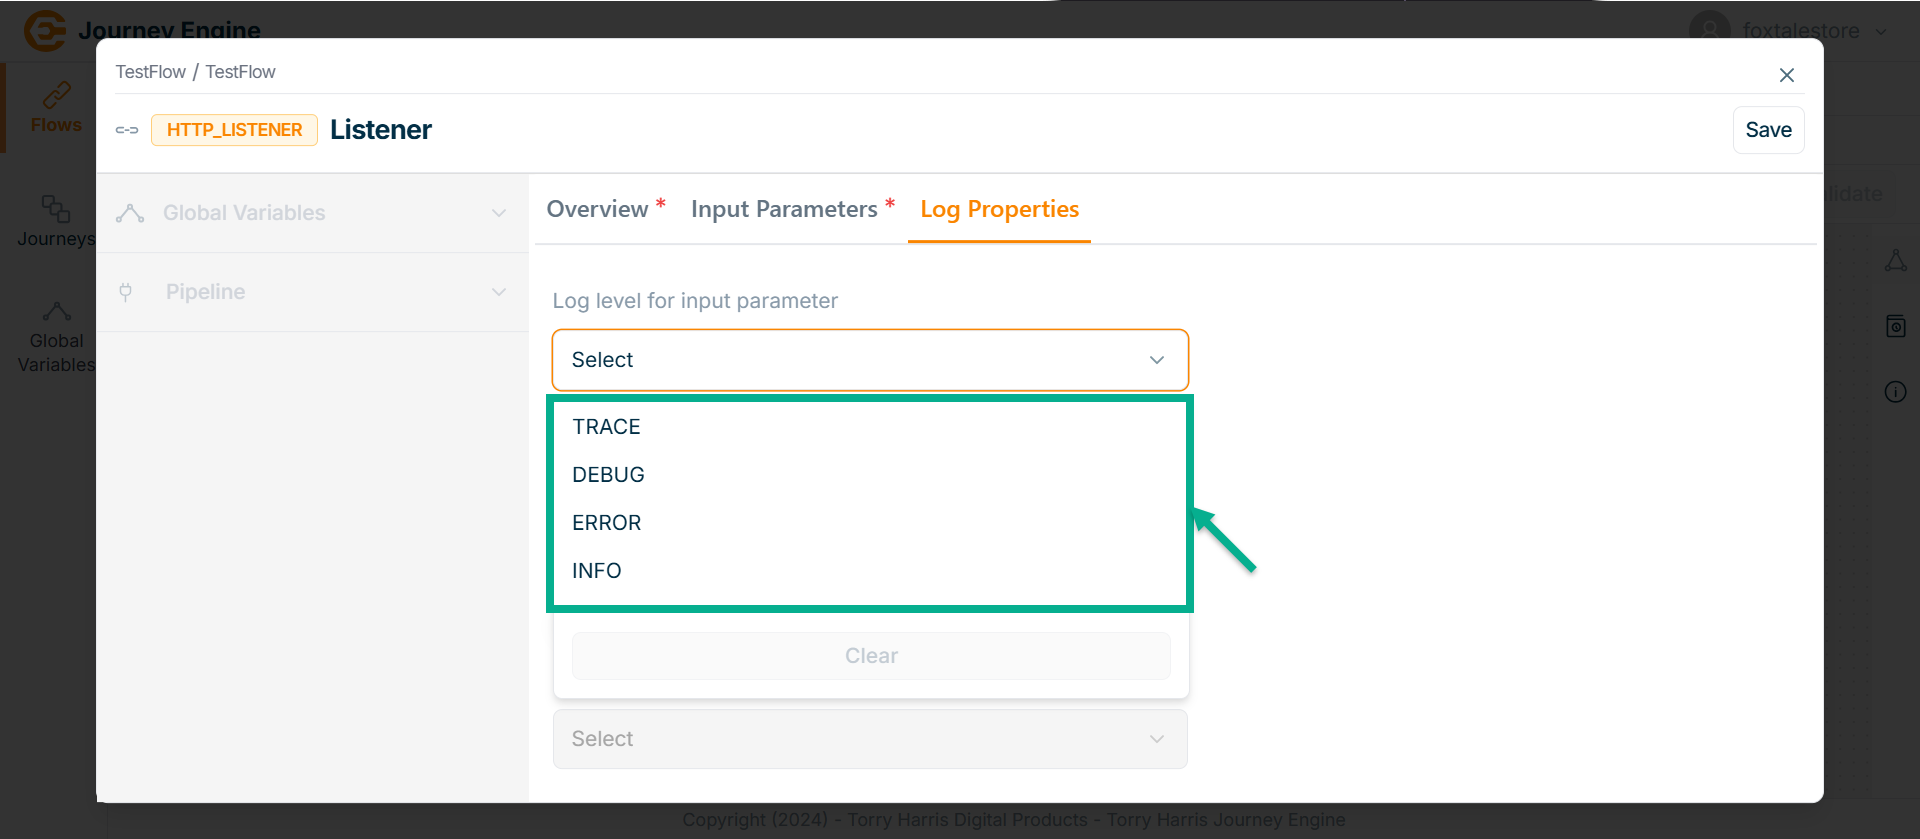
There are 4 Log Levels as per the above image:
| Log Levels | Description |
|---|---|
| Trace | This is a fine-grained information-finer even than DEBUG. When you’re at this level, you’re looking to capture every detail you possibly can about the application’s behavior. This allows the full visibility of what is happening in your application and inside the third-party libraries that you use. |
| Info | Designates informational messages that highlight the progress of the application at a coarse-grained level. |
| Debug | The DEBUG log level should be used for information that may be needed for diagnosing issues. It designates fine-grained informational events that are most useful for debugging and troubleshooting or to make sure everything is running correctly in the application. |
| Error | An error is a serious issue that represents the failure of something important going on in your application. This log level should be used when the application hits such type of issue preventing one or more functionalities from properly functioning. |
-
Select as DEBUG.
-
Click on Select input parameters dropdown.
The dropdown appears as shown in the below screen.
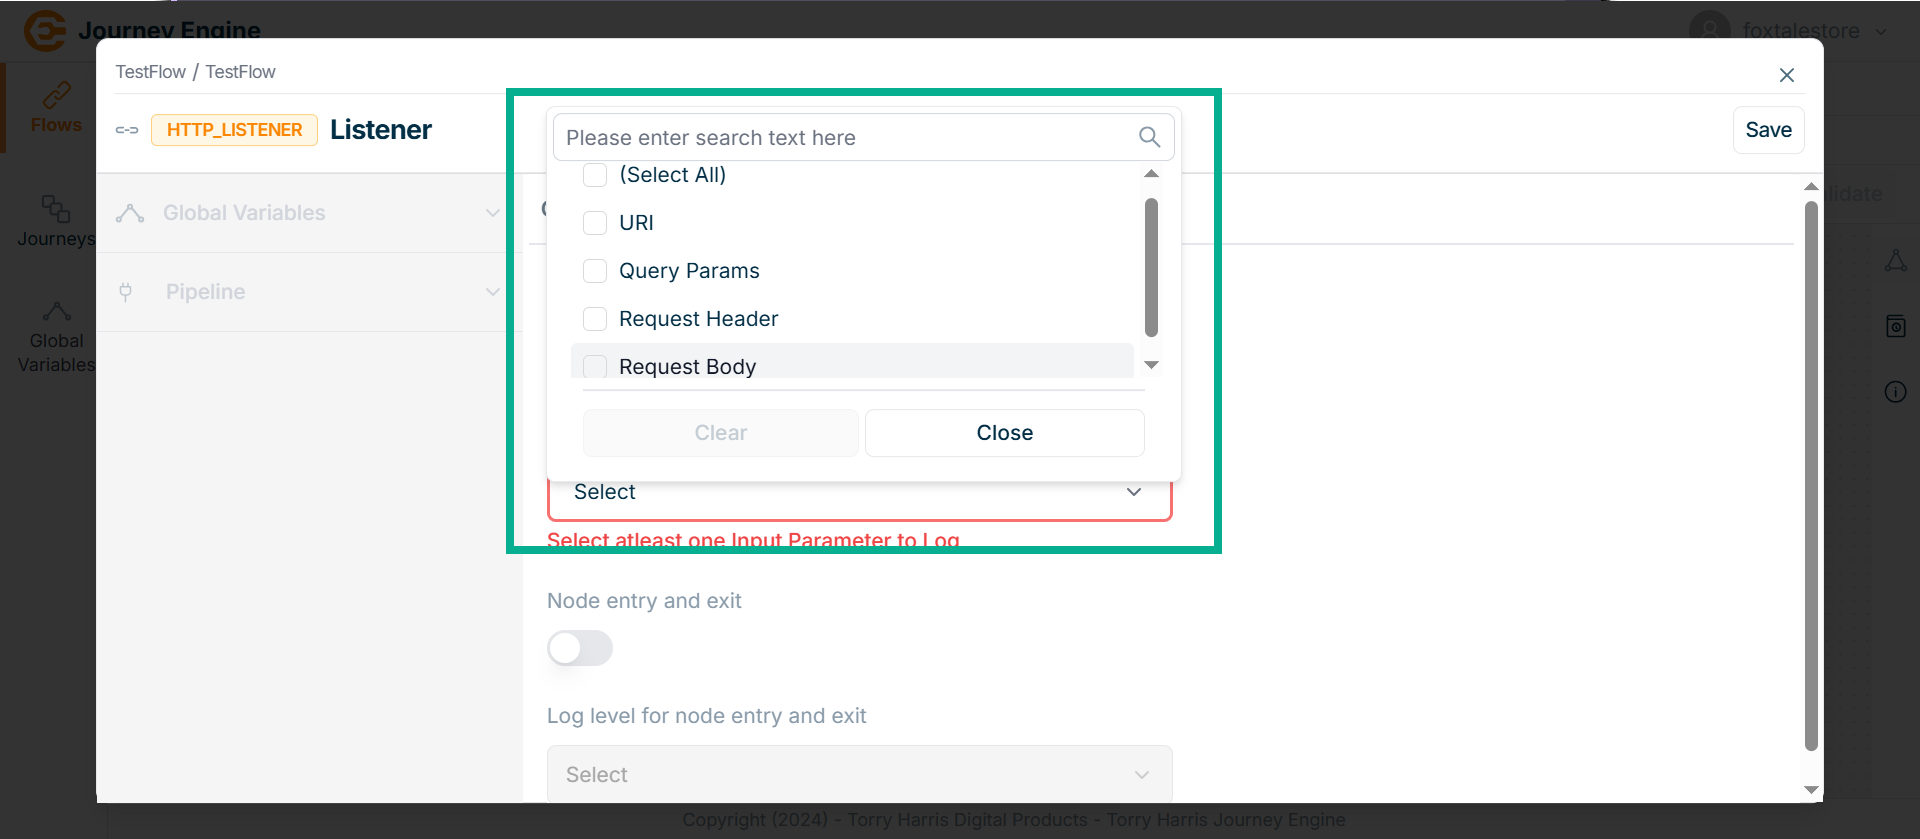
-
Select the Input Parameter to Log.
-
Enable the Node entry and exit.
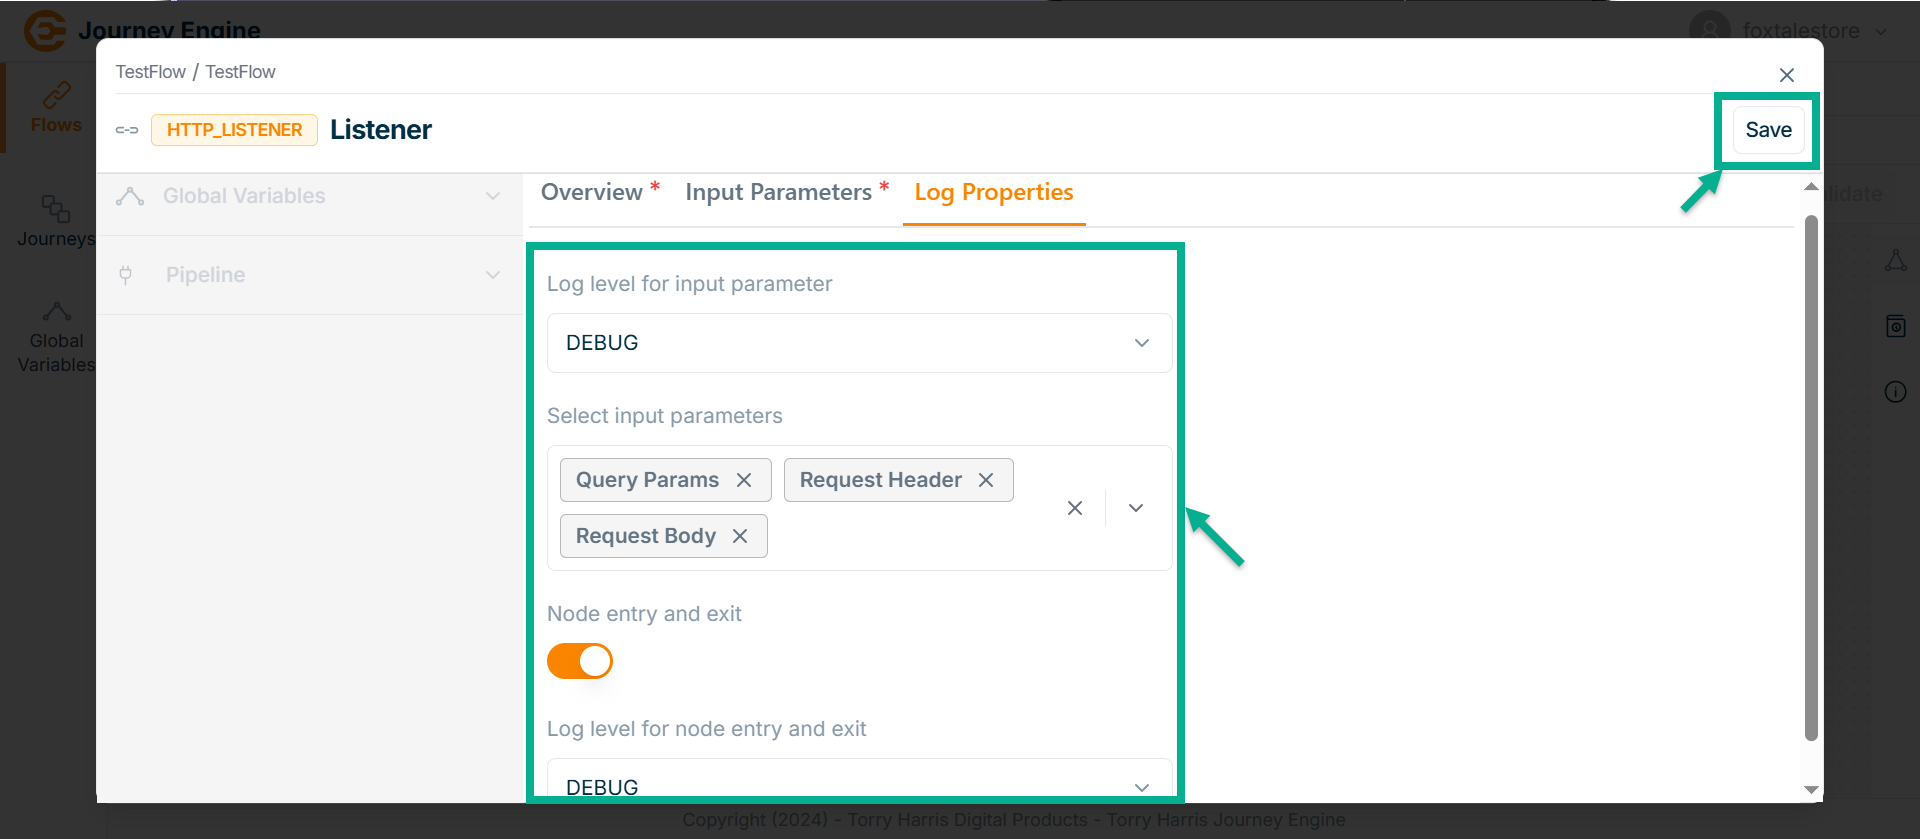
-
Click on Log level for node entry and exit dropdown.
-
Select as DEBUG.
-
Click Save.
-
Click on Close button to close the HTTP Listener Node.
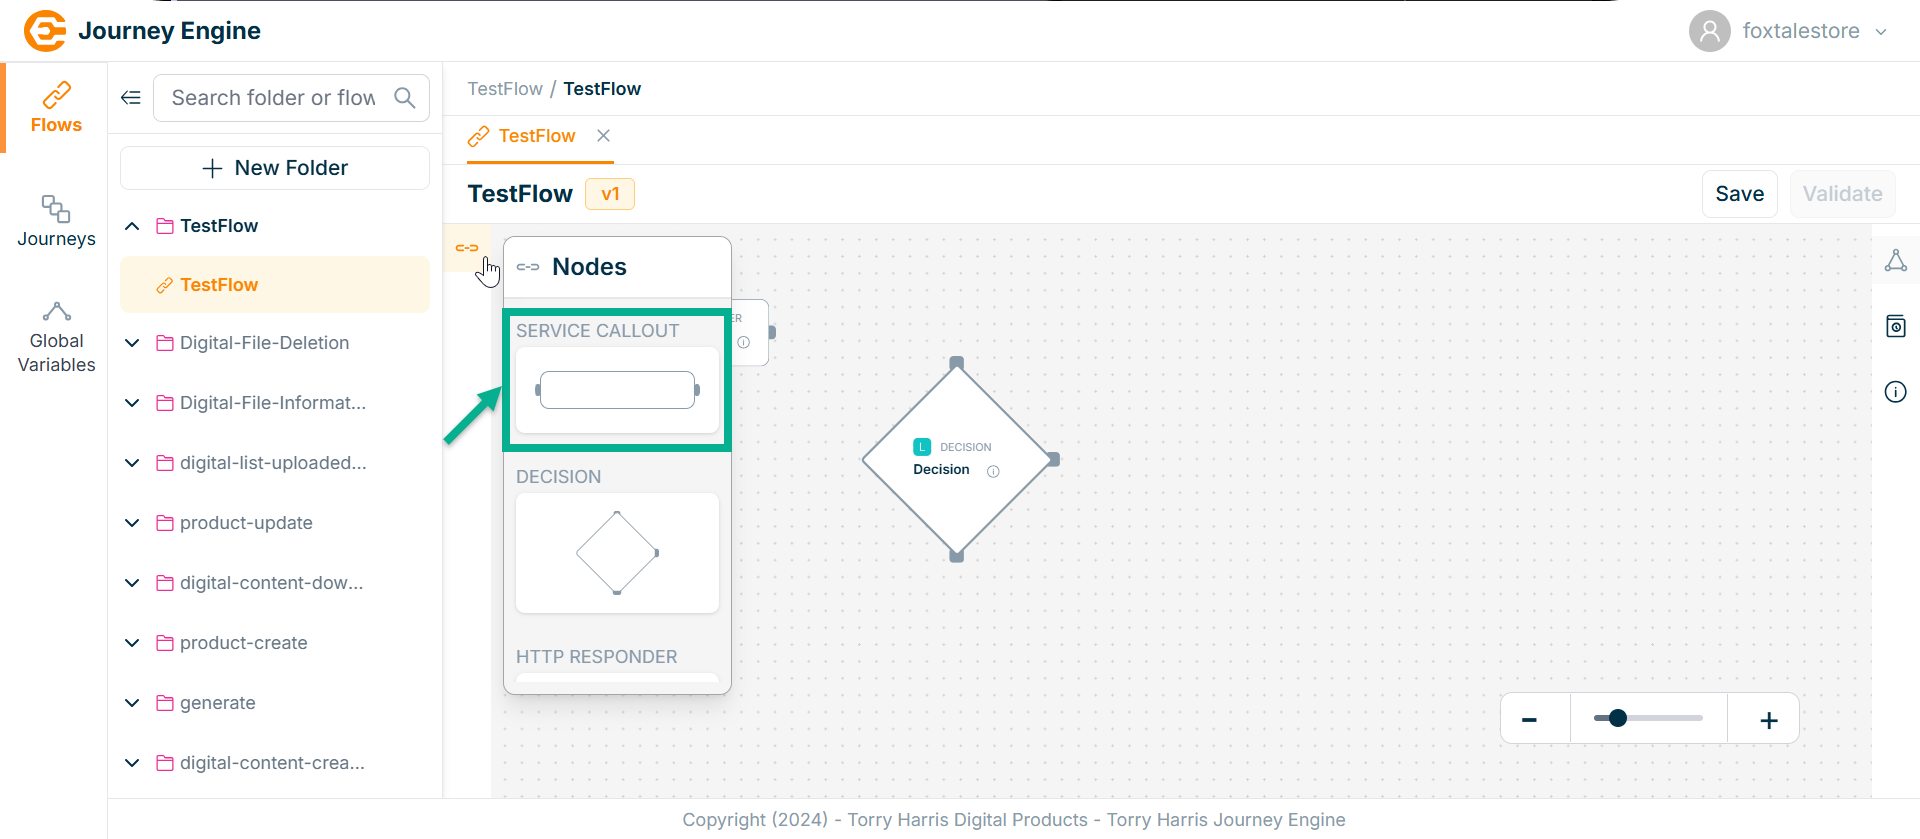
Decision Node
- Click on Nodes icon.
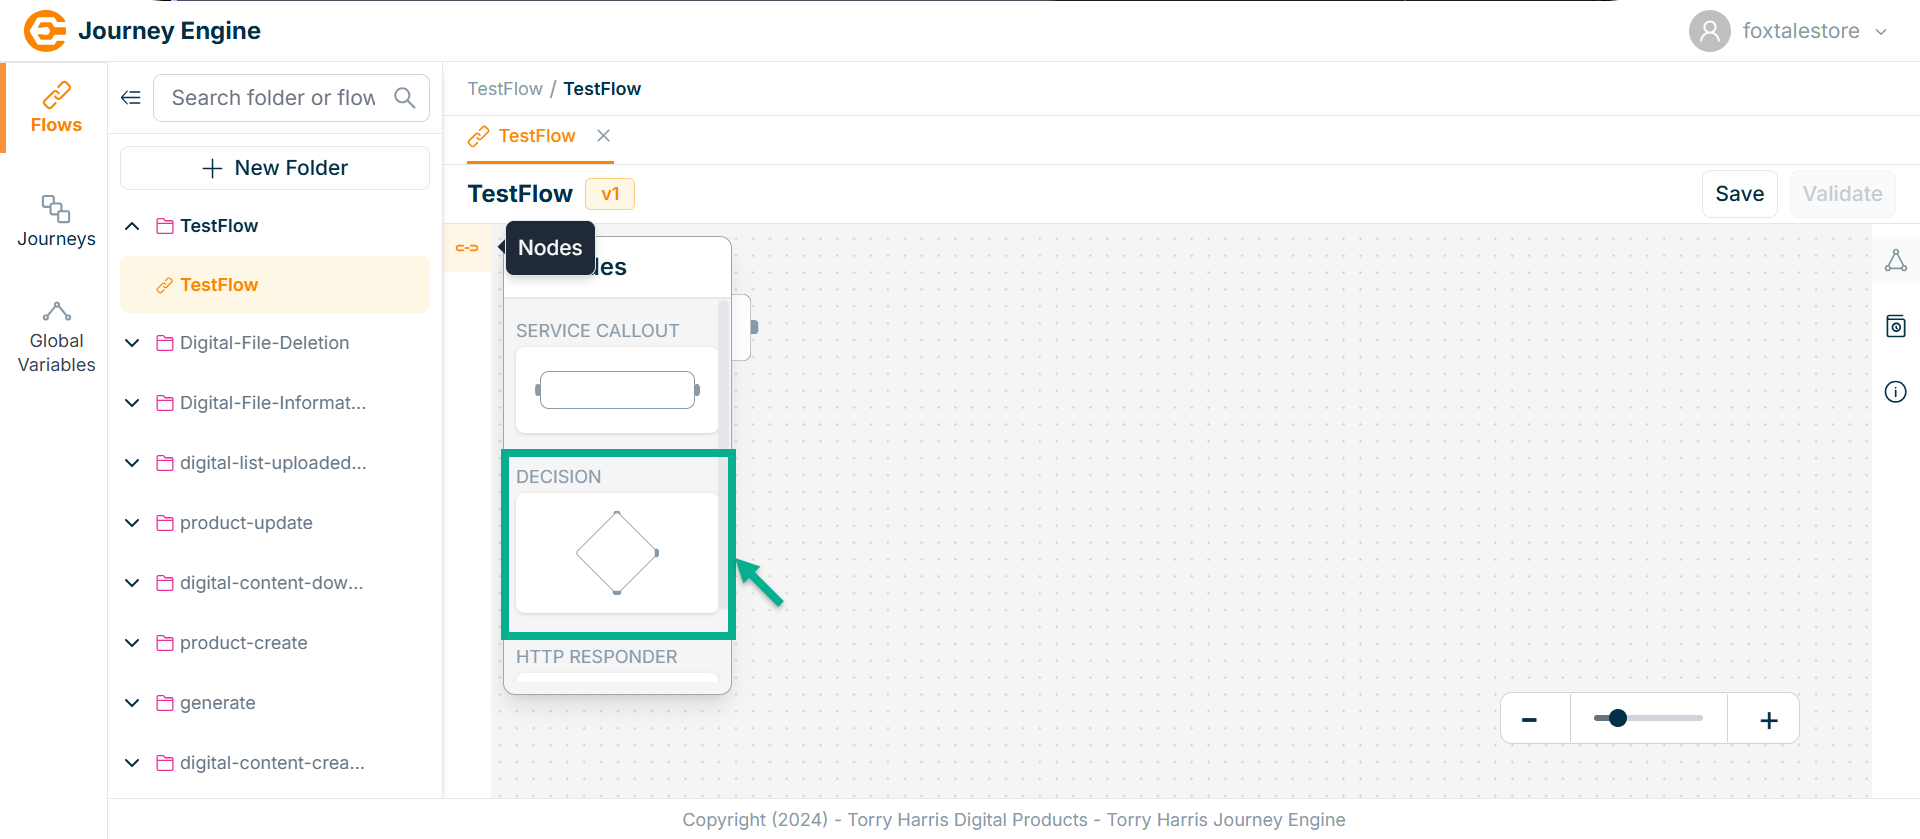
-
Click and drag the Decision Node into the canvas.
-
Click on the Edit icon.
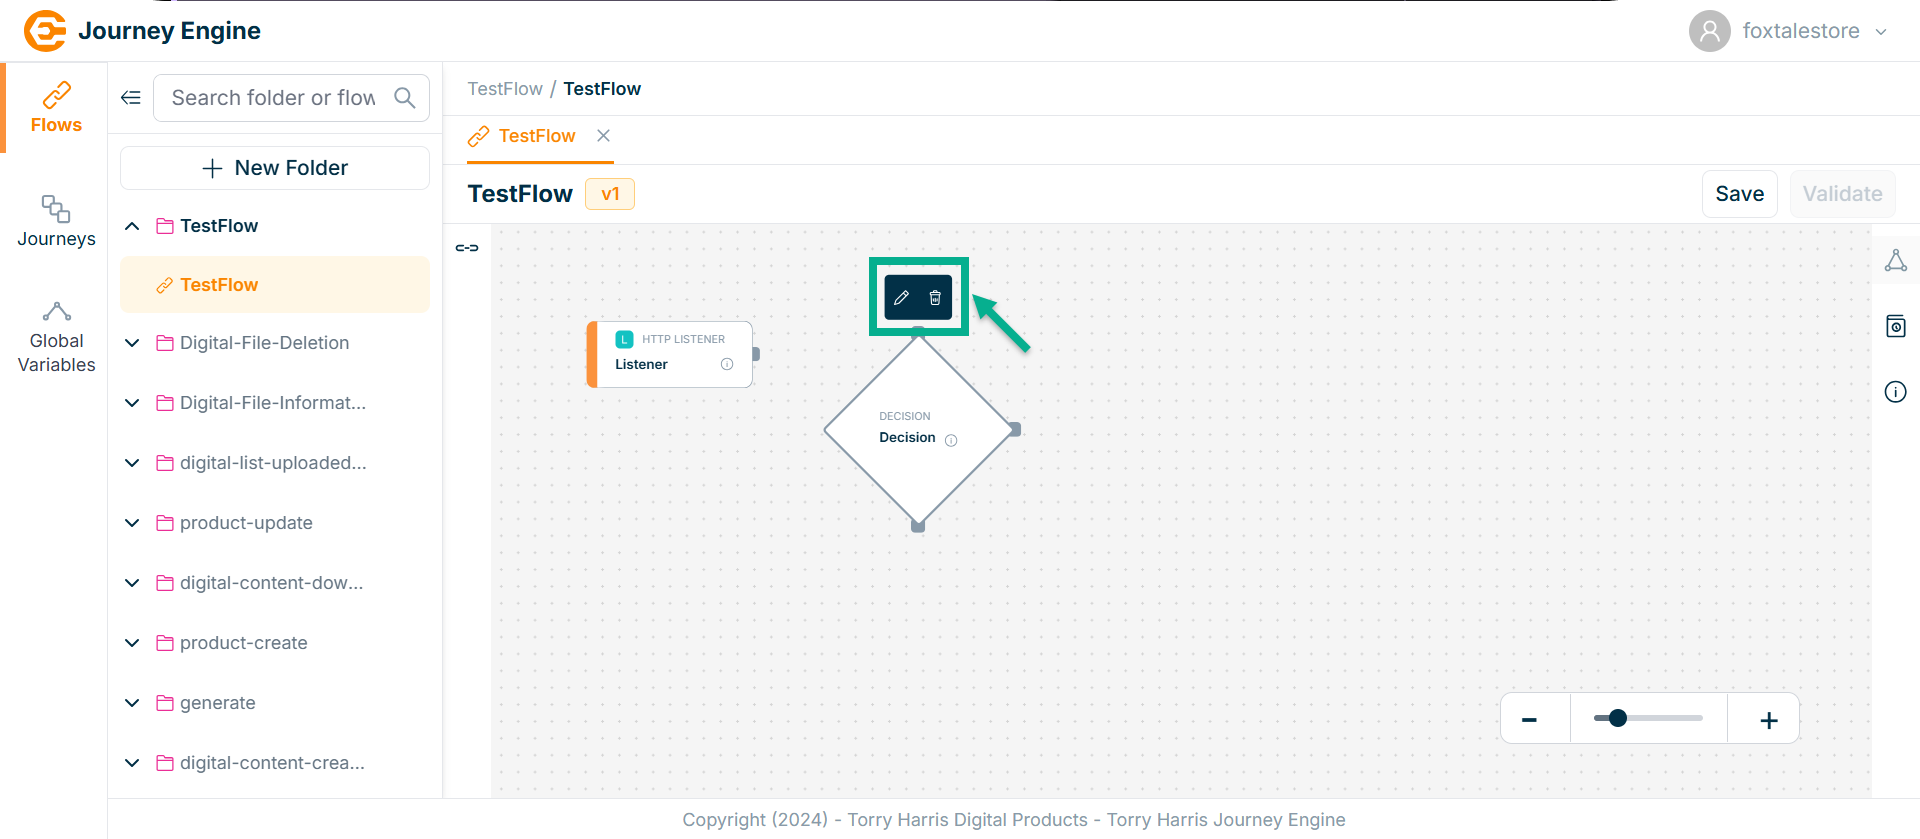
Click Delete to delete the node.
The Decision screen apperas as shown below
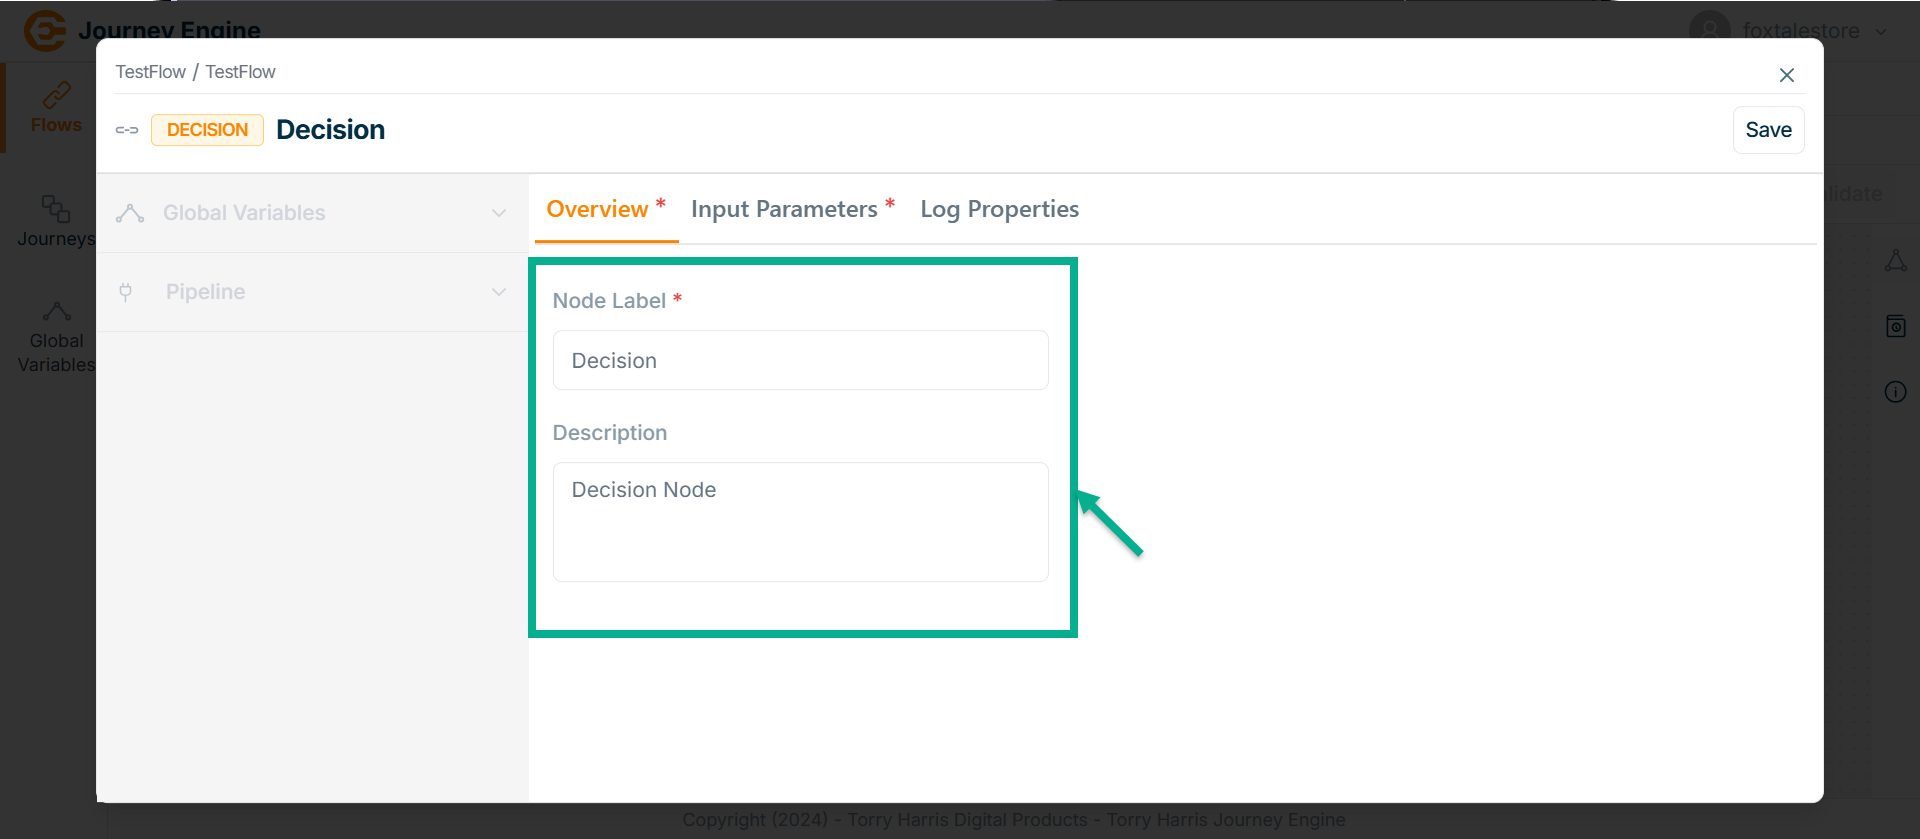
-
Enter Node Label and Description.
-
Click Save.
-
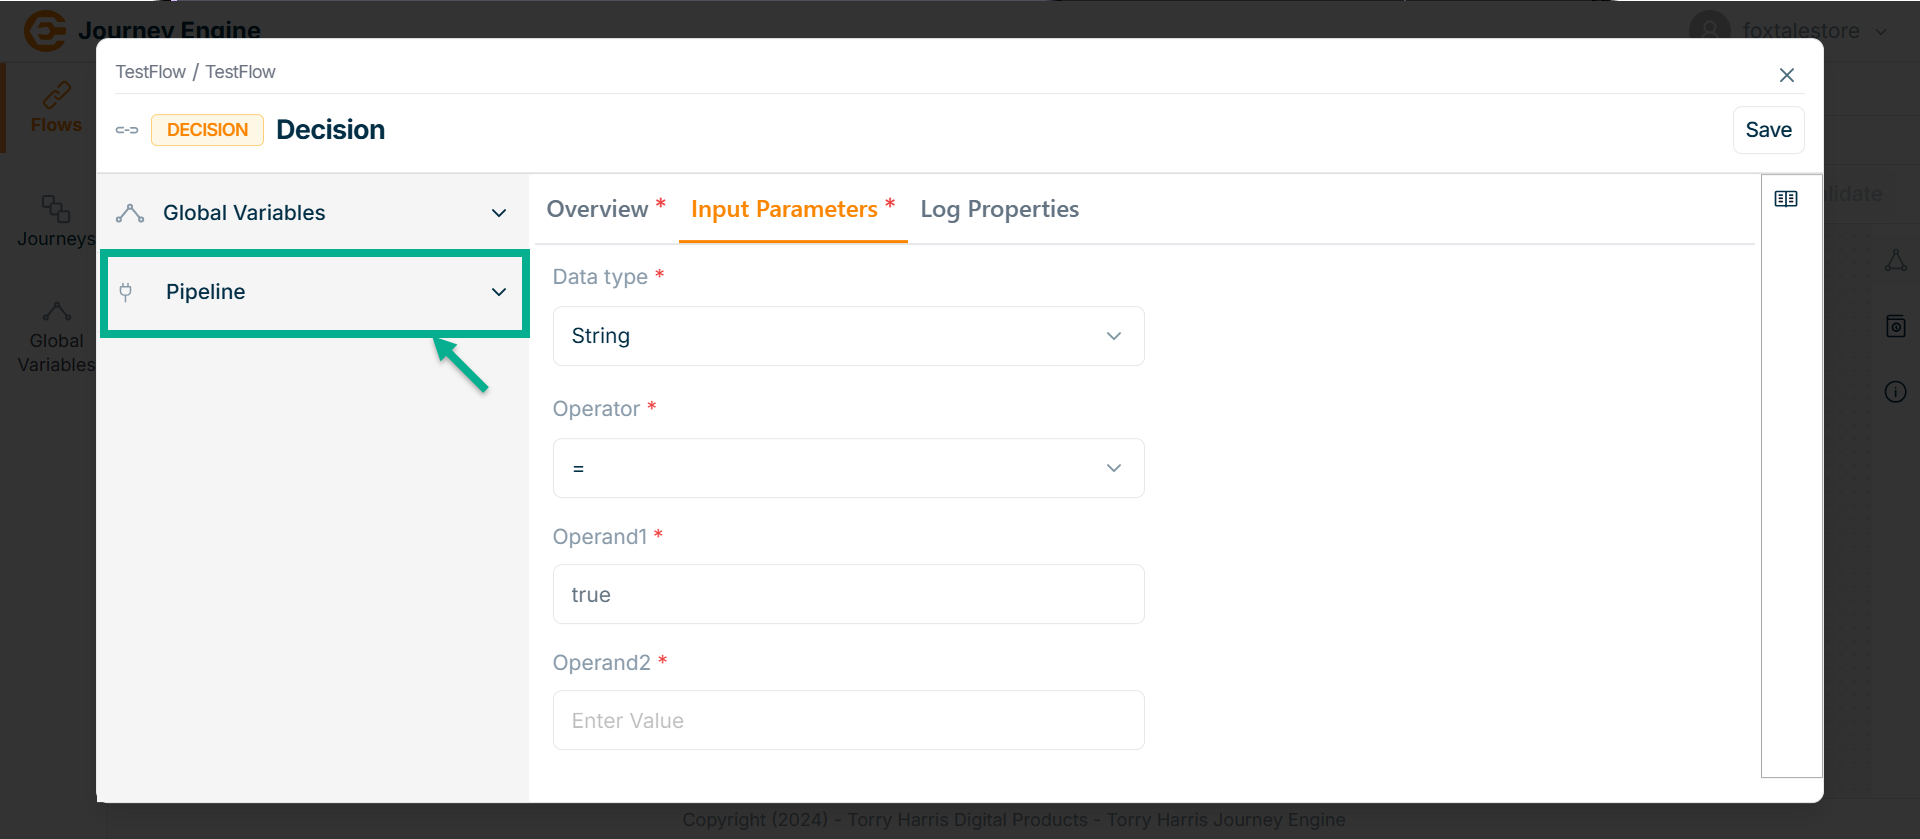
Go to Input Parameters.
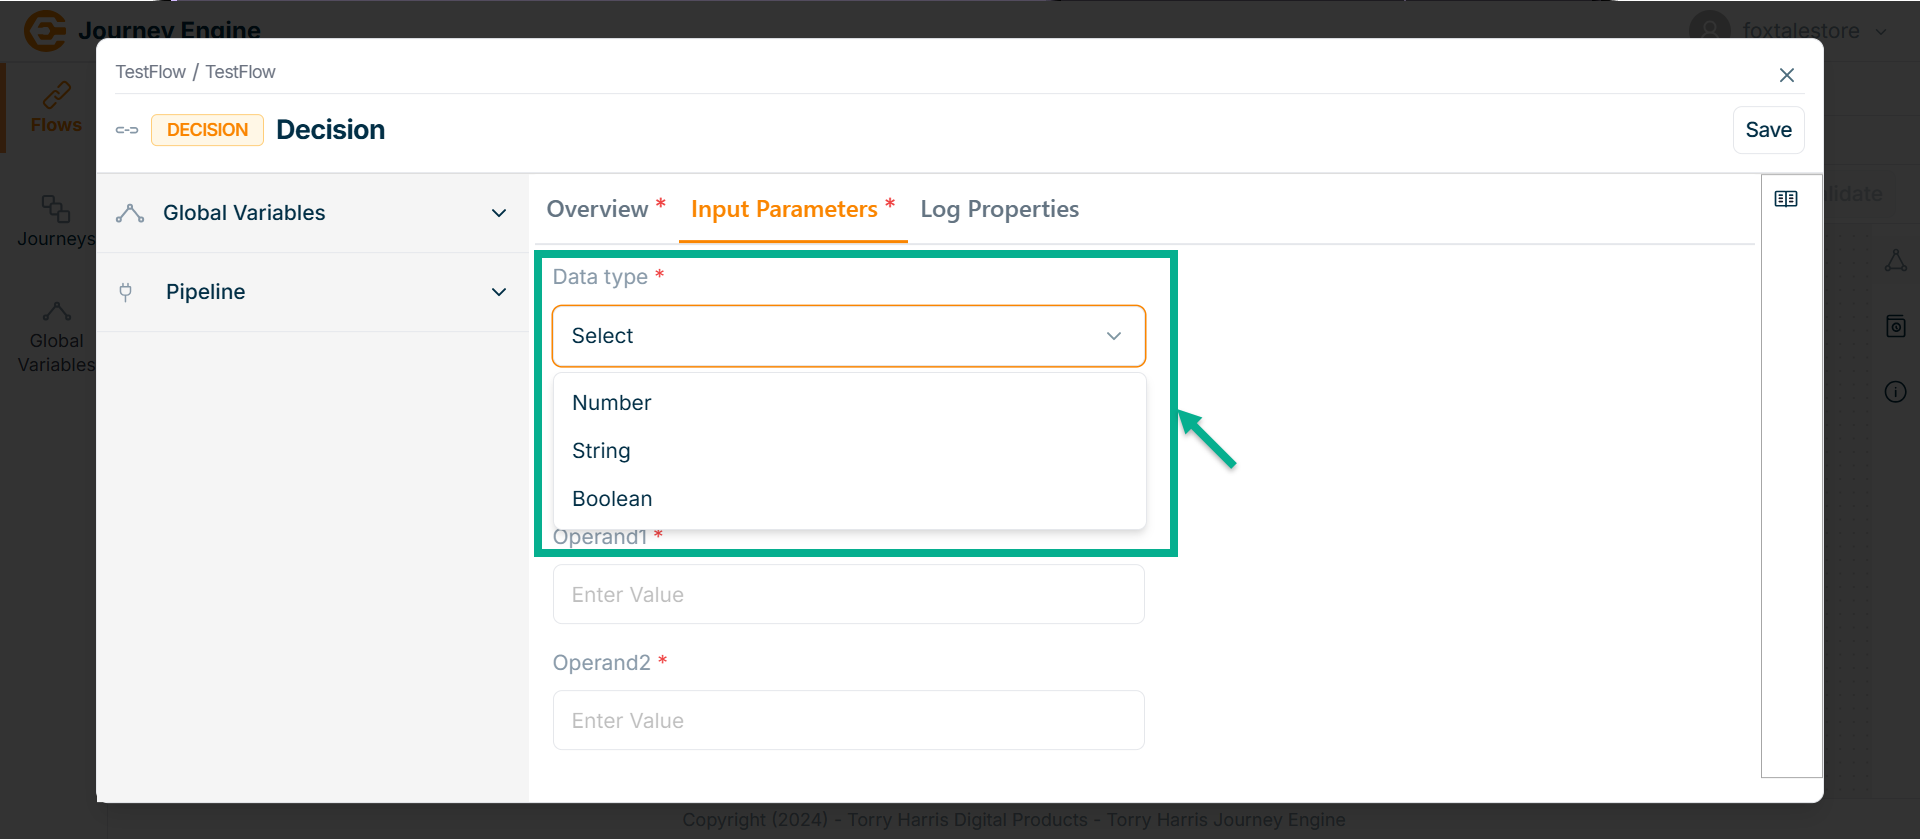
-
Select the Data type from the dropdown. Here taking the example of String data type.
-
Select the Operator from the dropdown.
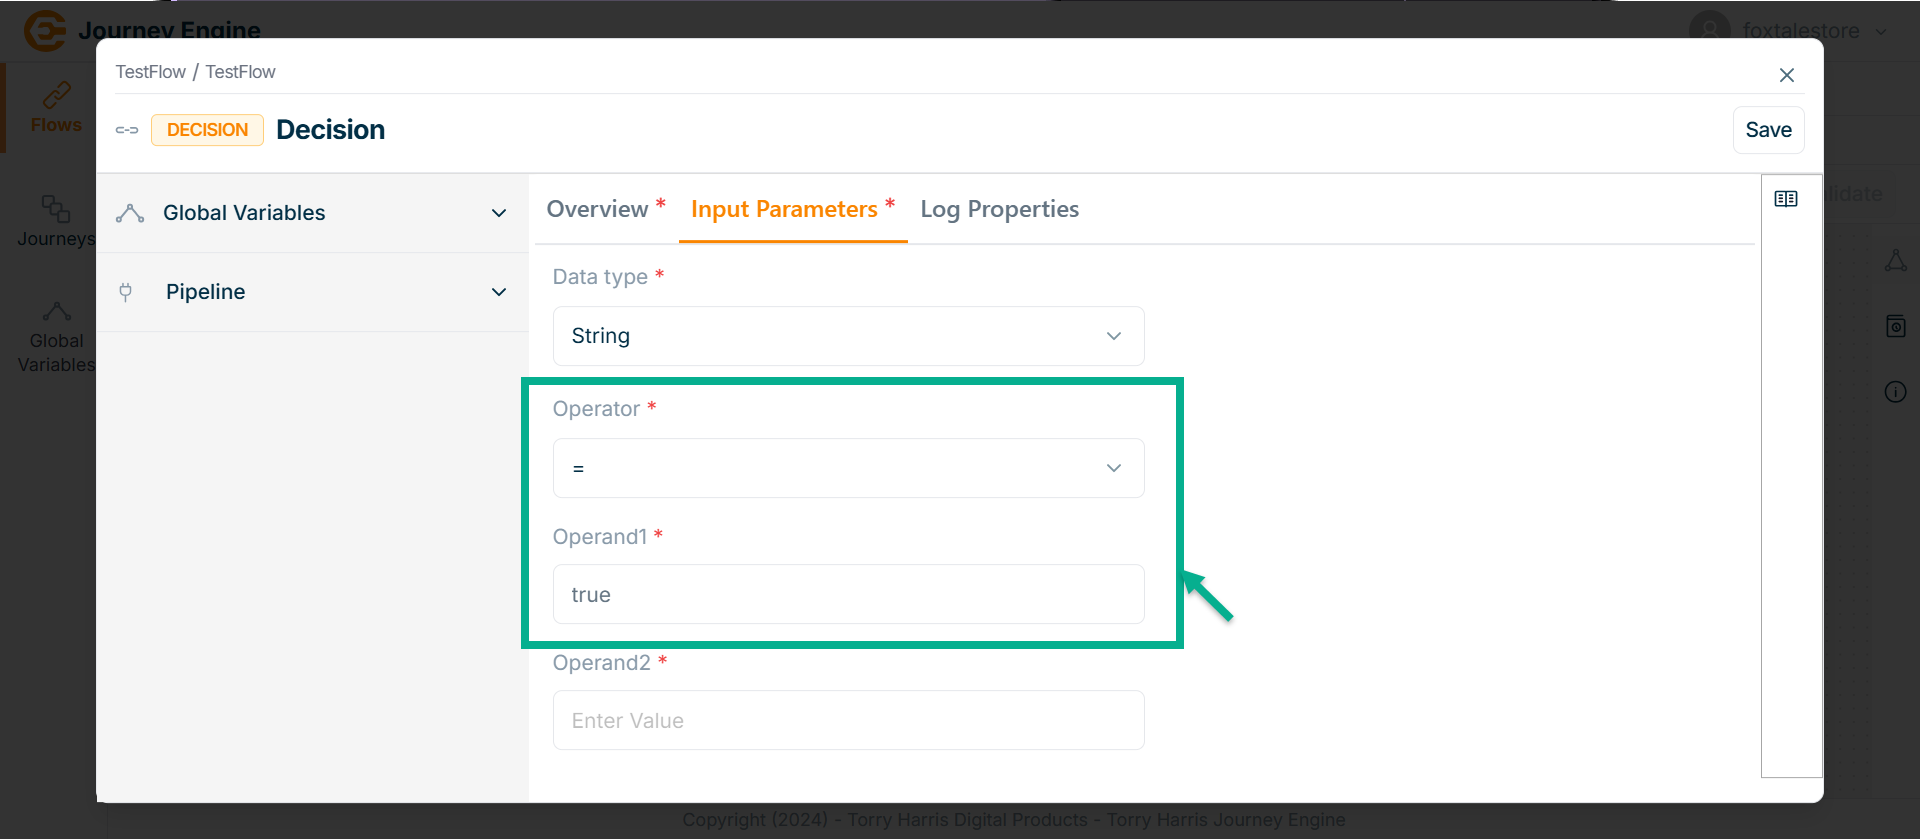
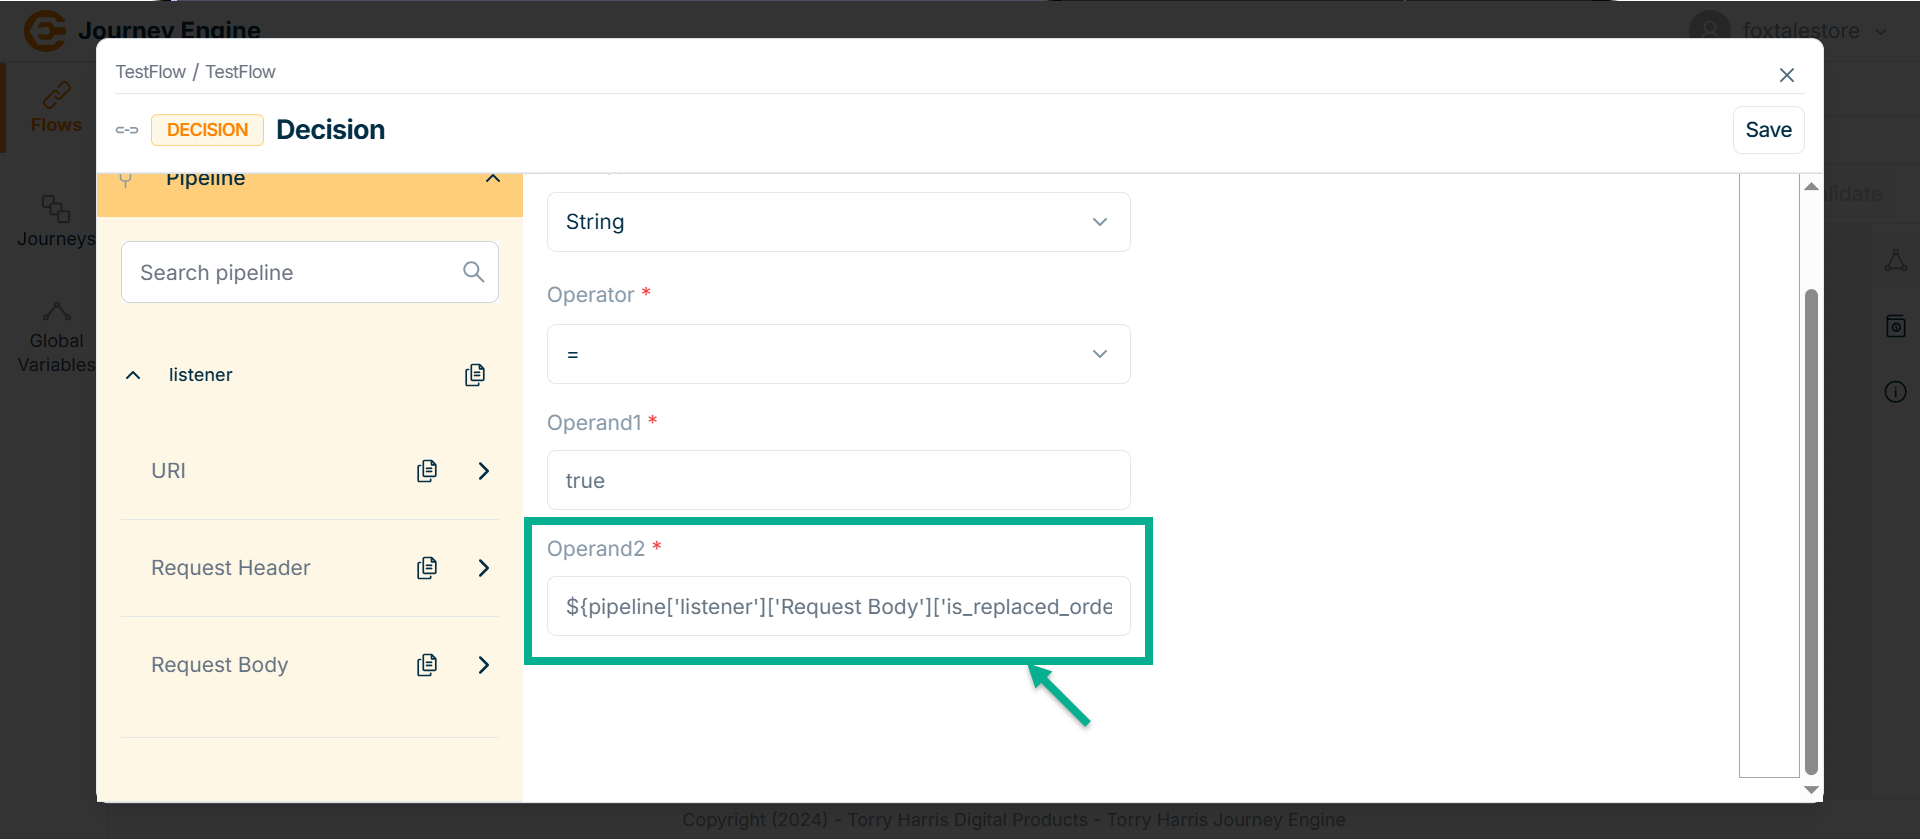
- Enter Operand1.
Operands can be added by using pipeline.
Adding the pipeline
- Click on Pipeline dropdown.
The Pipeline section displays a list of all available pipelines.
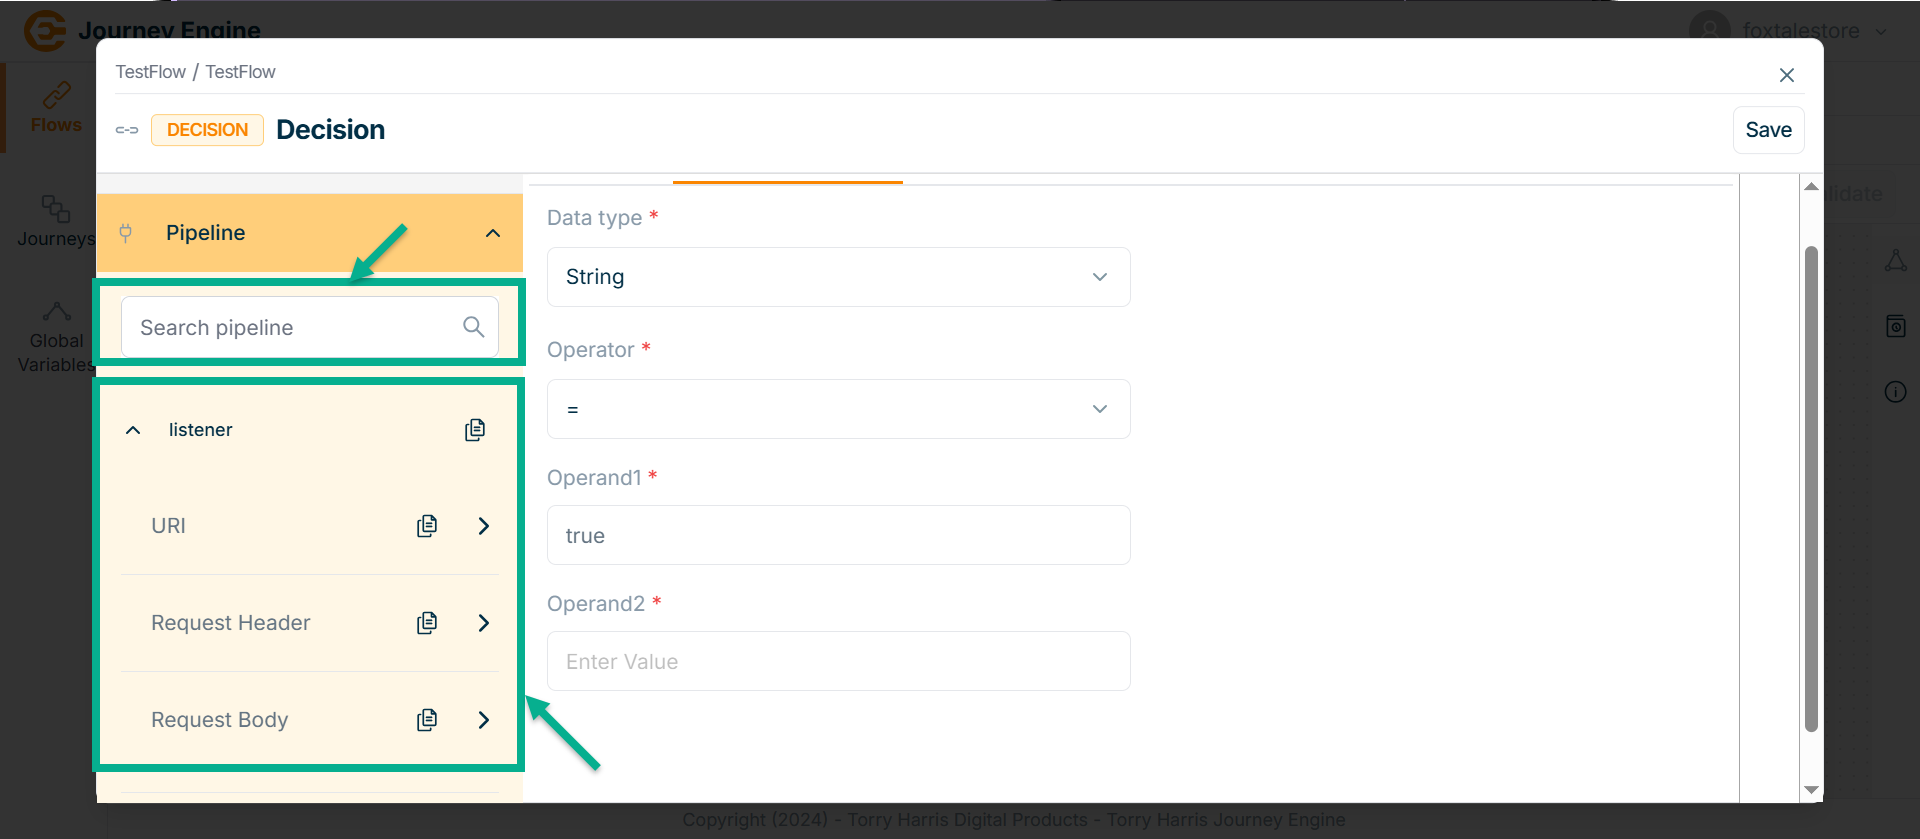
Use the search function to filter certain Pipeline.
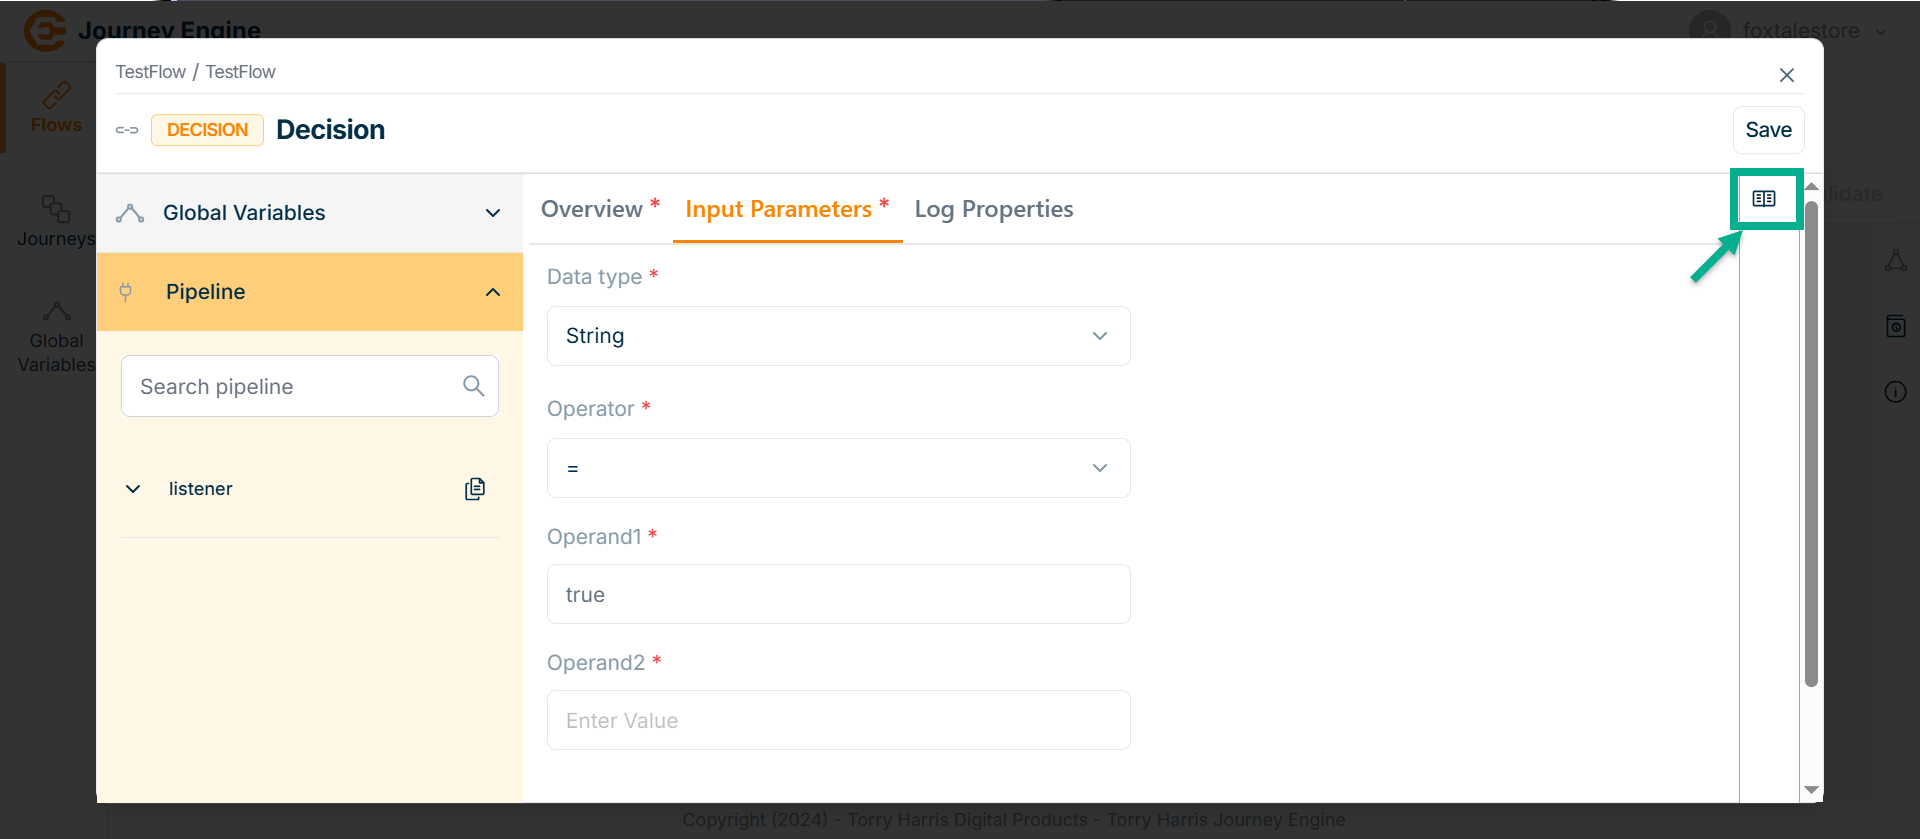
- Click on Syntax Reference.
In the Syntax Reference section, a pipeline path parameter value is provided.
Users can copy and paste it directly to specify the exact required path.
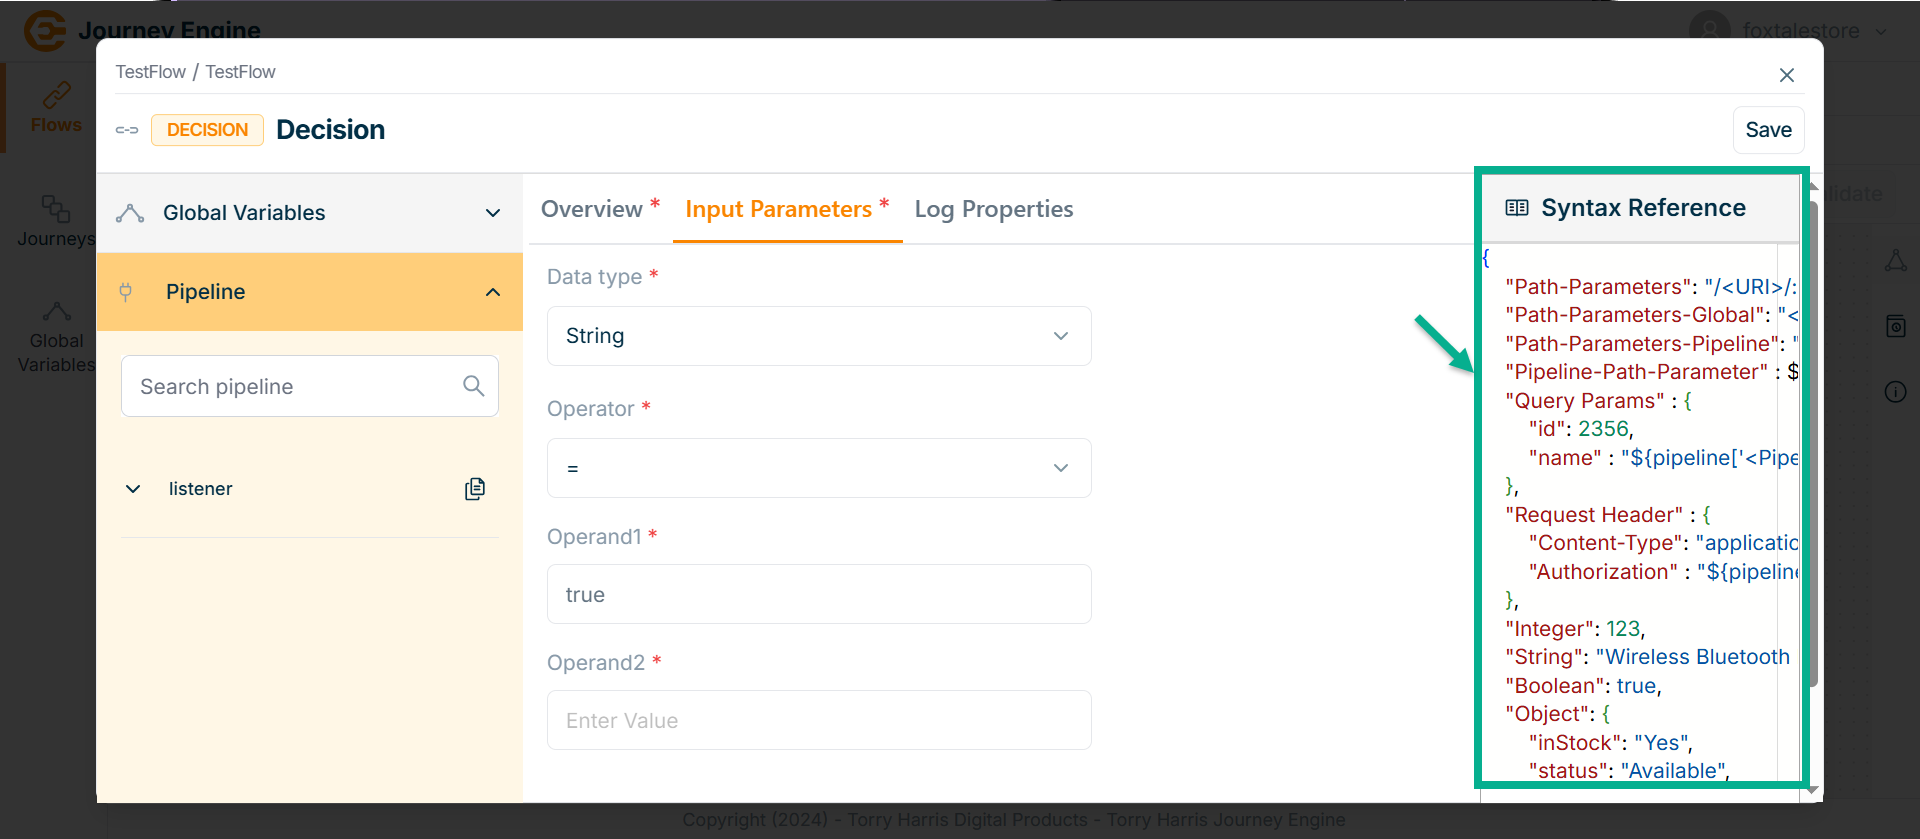
-
Copy the syntax into the field and modify it as needed based on your requirements.
-
Copy the exact path using the pipeline section.
-
Click Save.
-
Go to Log Properties.
-
Select the Log level for input parameter from the dropdown.
-
Select Input parameters from the dropdown.
-
Enable the Node entry and exit.
-
Select Log level for node entry and exit from the dropdown.
-
Click Save.
-
Click on Close button to close the Decision Node.
Service Callout Node
- Click on Nodes icon.
-
Click and drag the Service Callout Node into the canvas.
-
Click on the Edit icon.
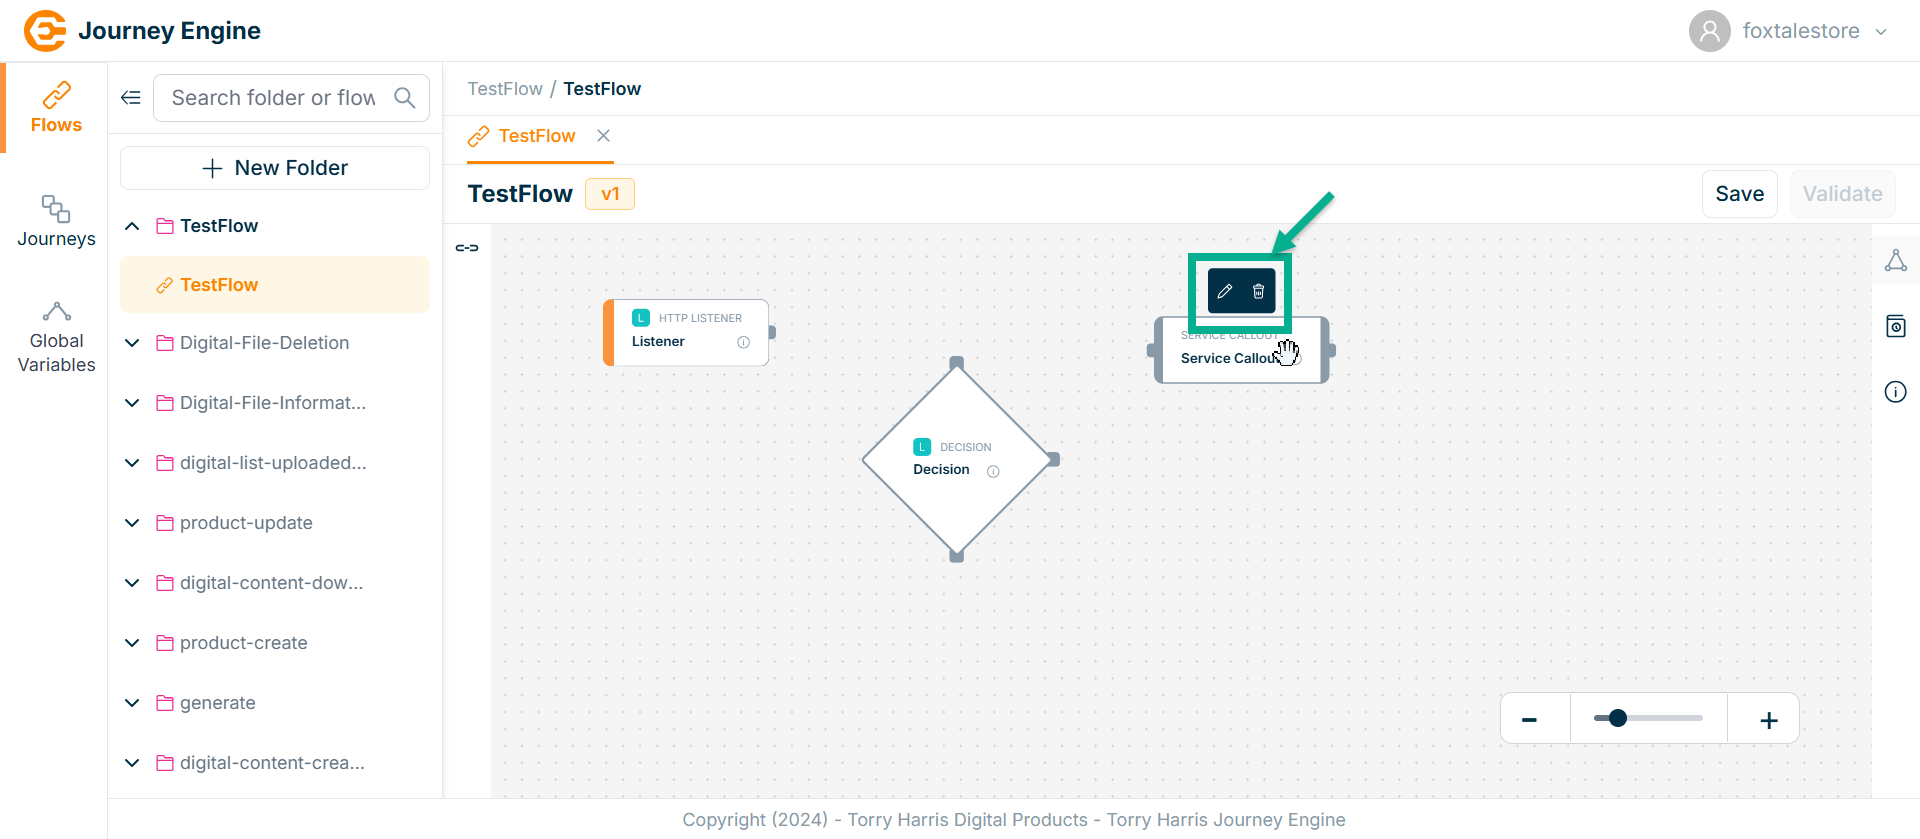
Click Delete to delete the node.
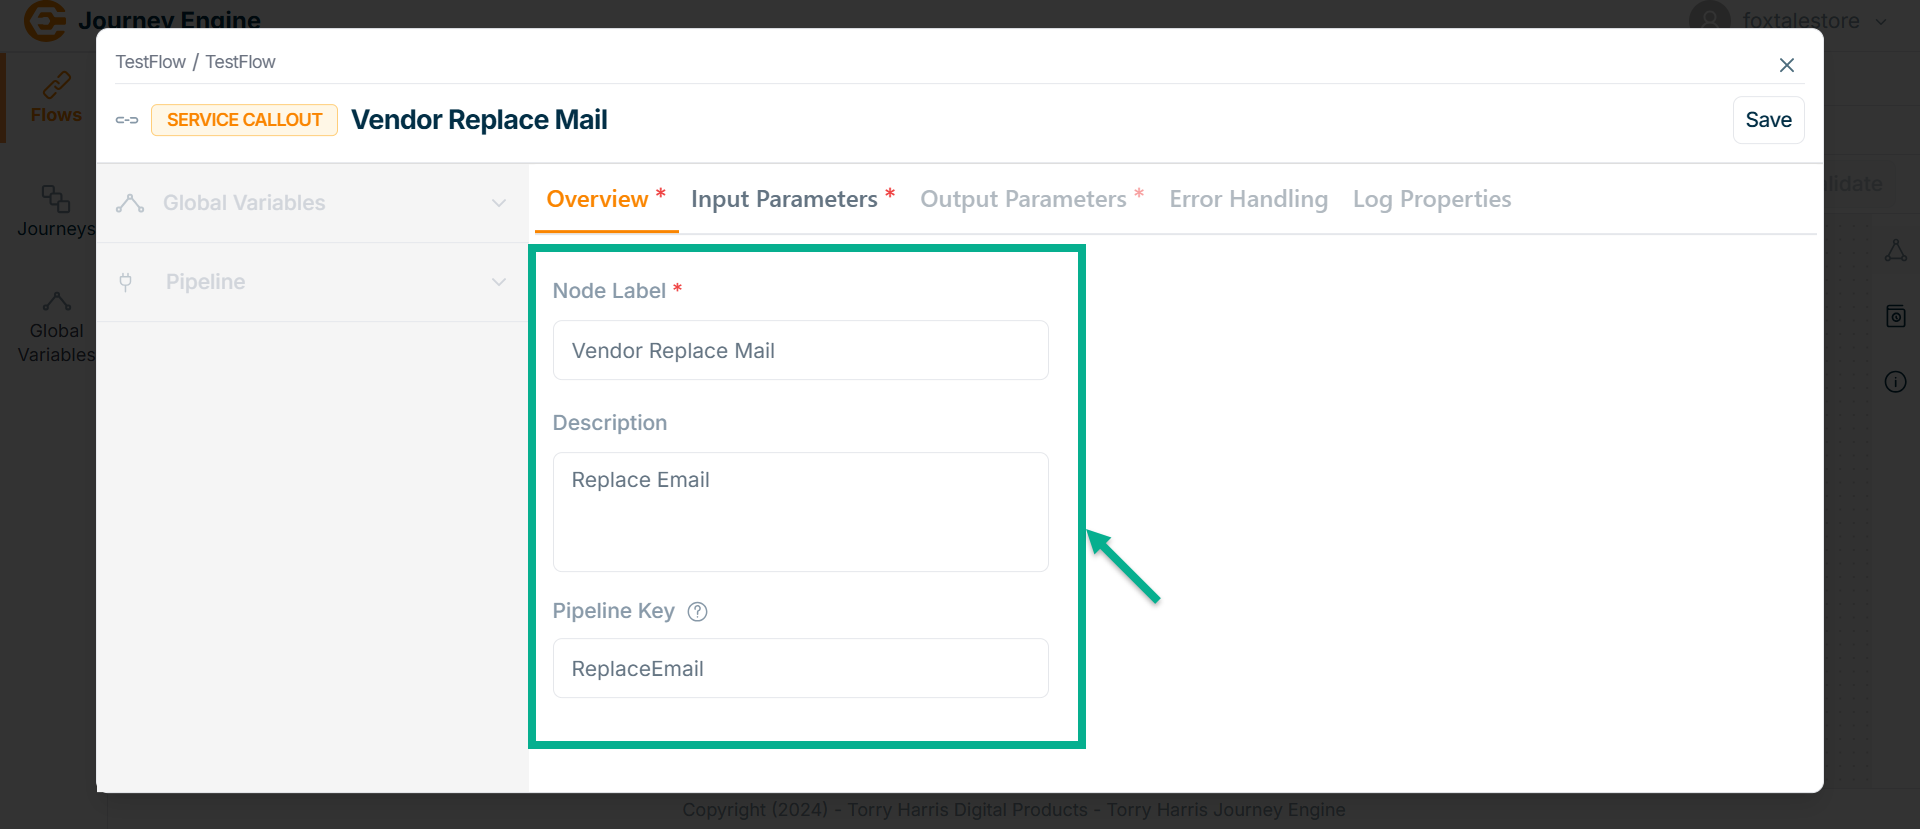
The Service Callout screen apperas as shown below
-
Enter Node Label and Description.
-
Enter Pipeline Key.
-
Click Save.
-
Go to Input Parameter.
The Input Parameter screen apperas as shown below
- Click on Methods field.
The Methods dropdown is shown as below.
Adding Global Variable
Click on Global Variables dropdown.
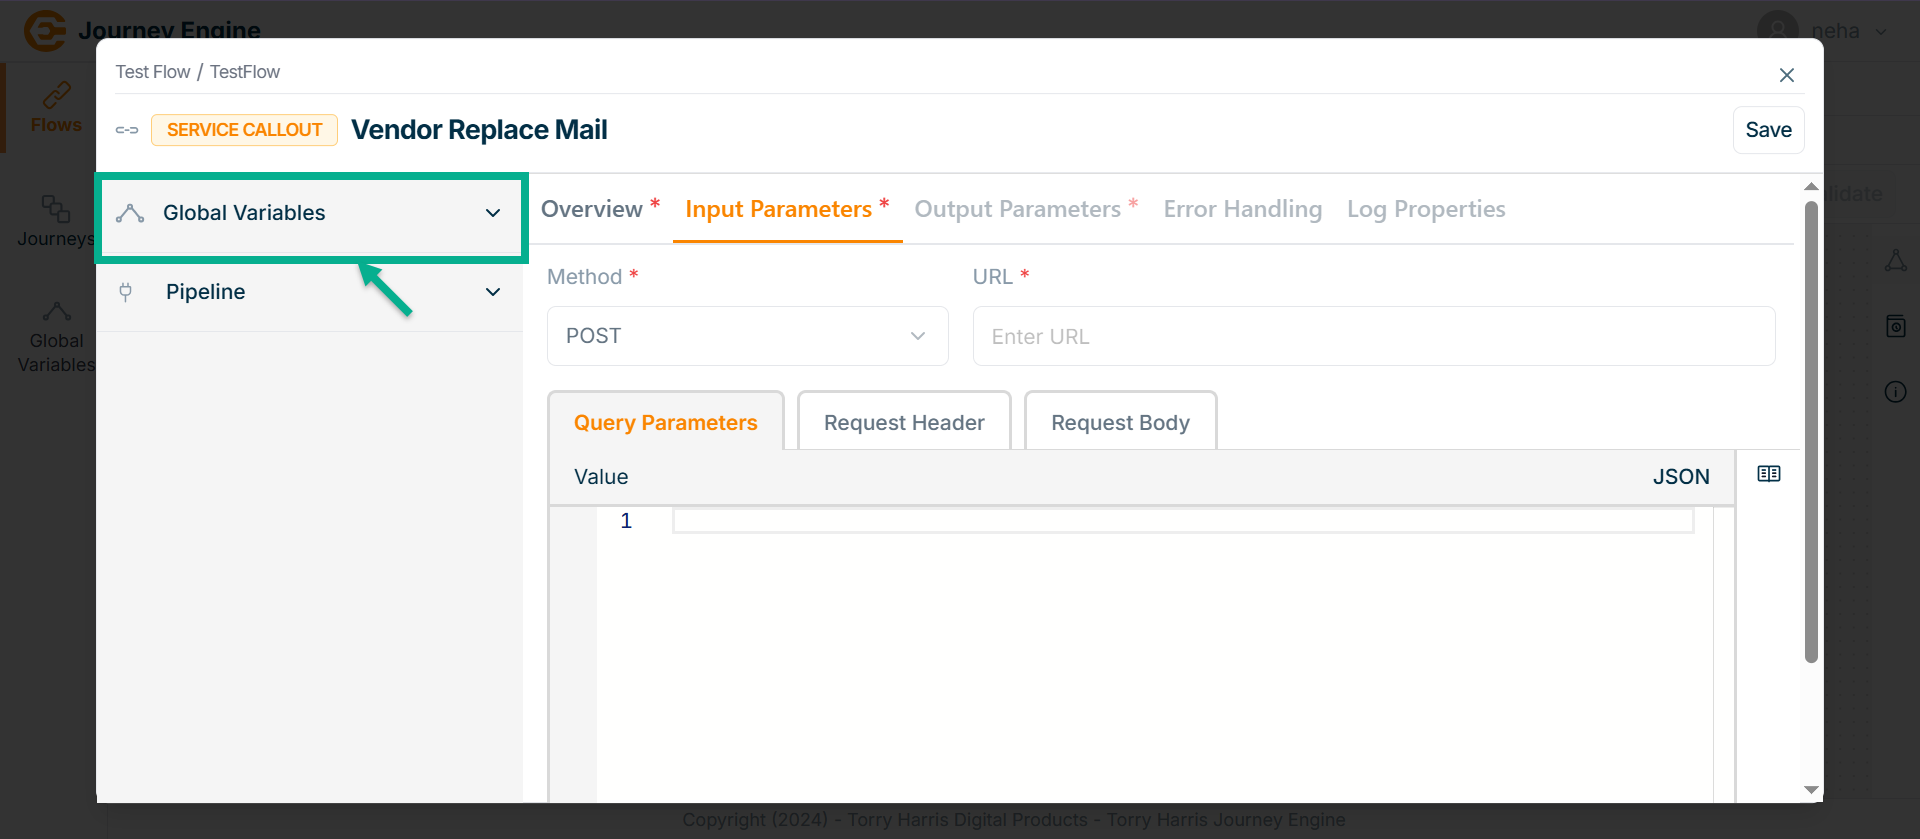
The Global Variables section displays a list of all available variables.
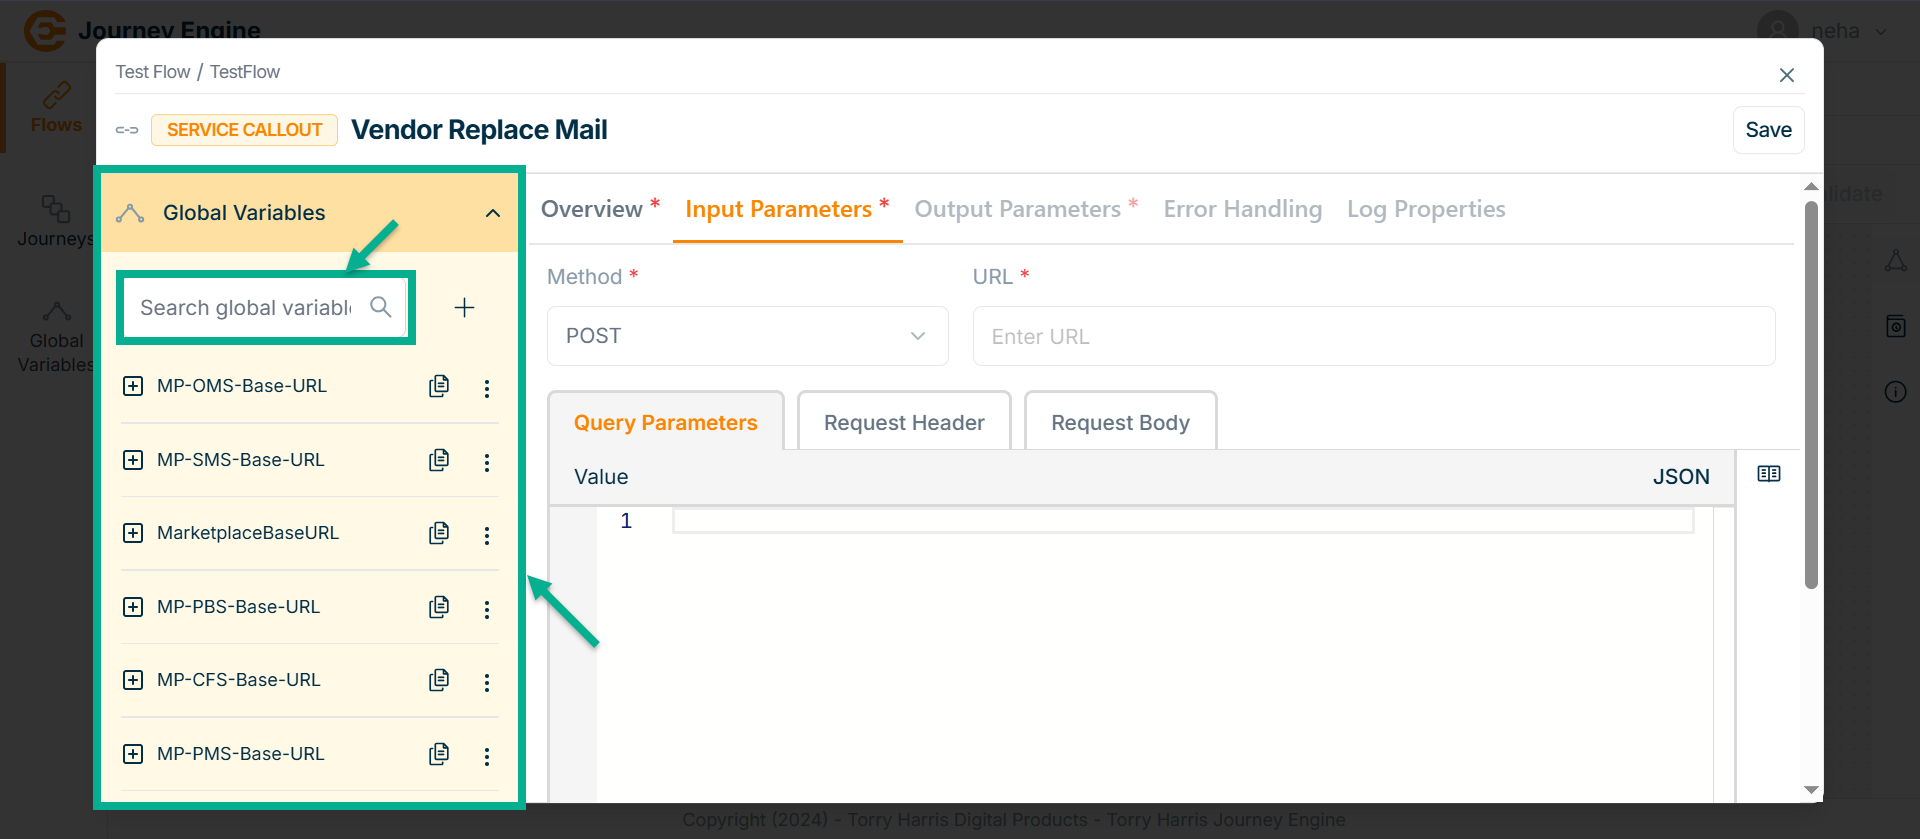
Use the search function to filter certain Variables.
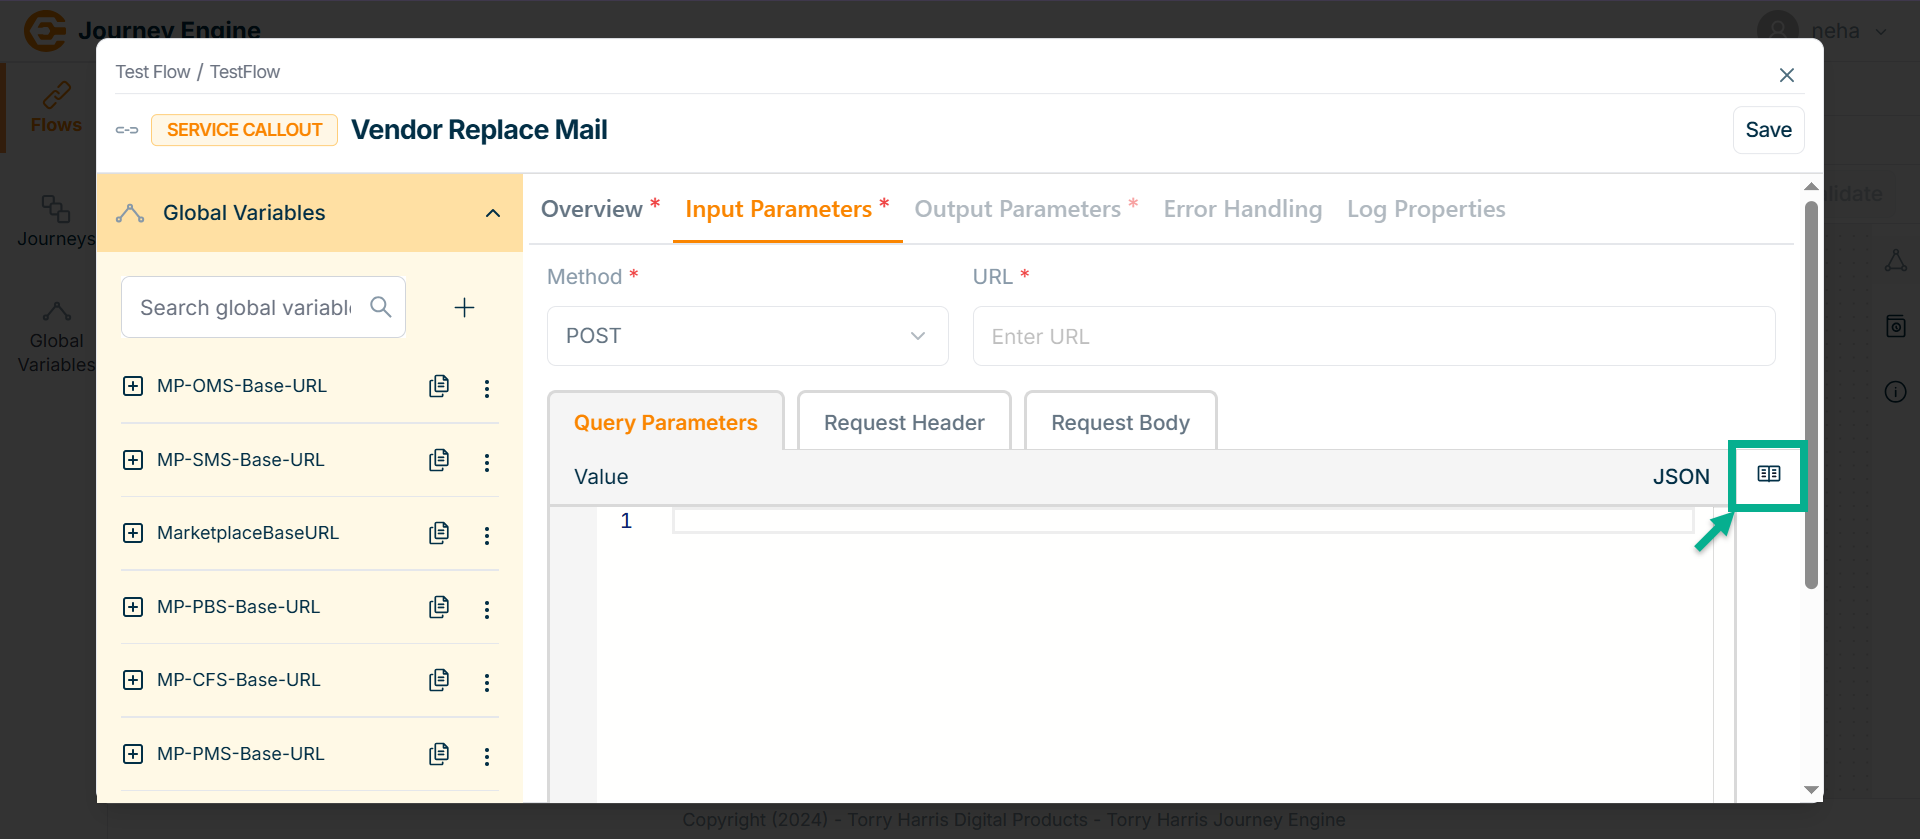
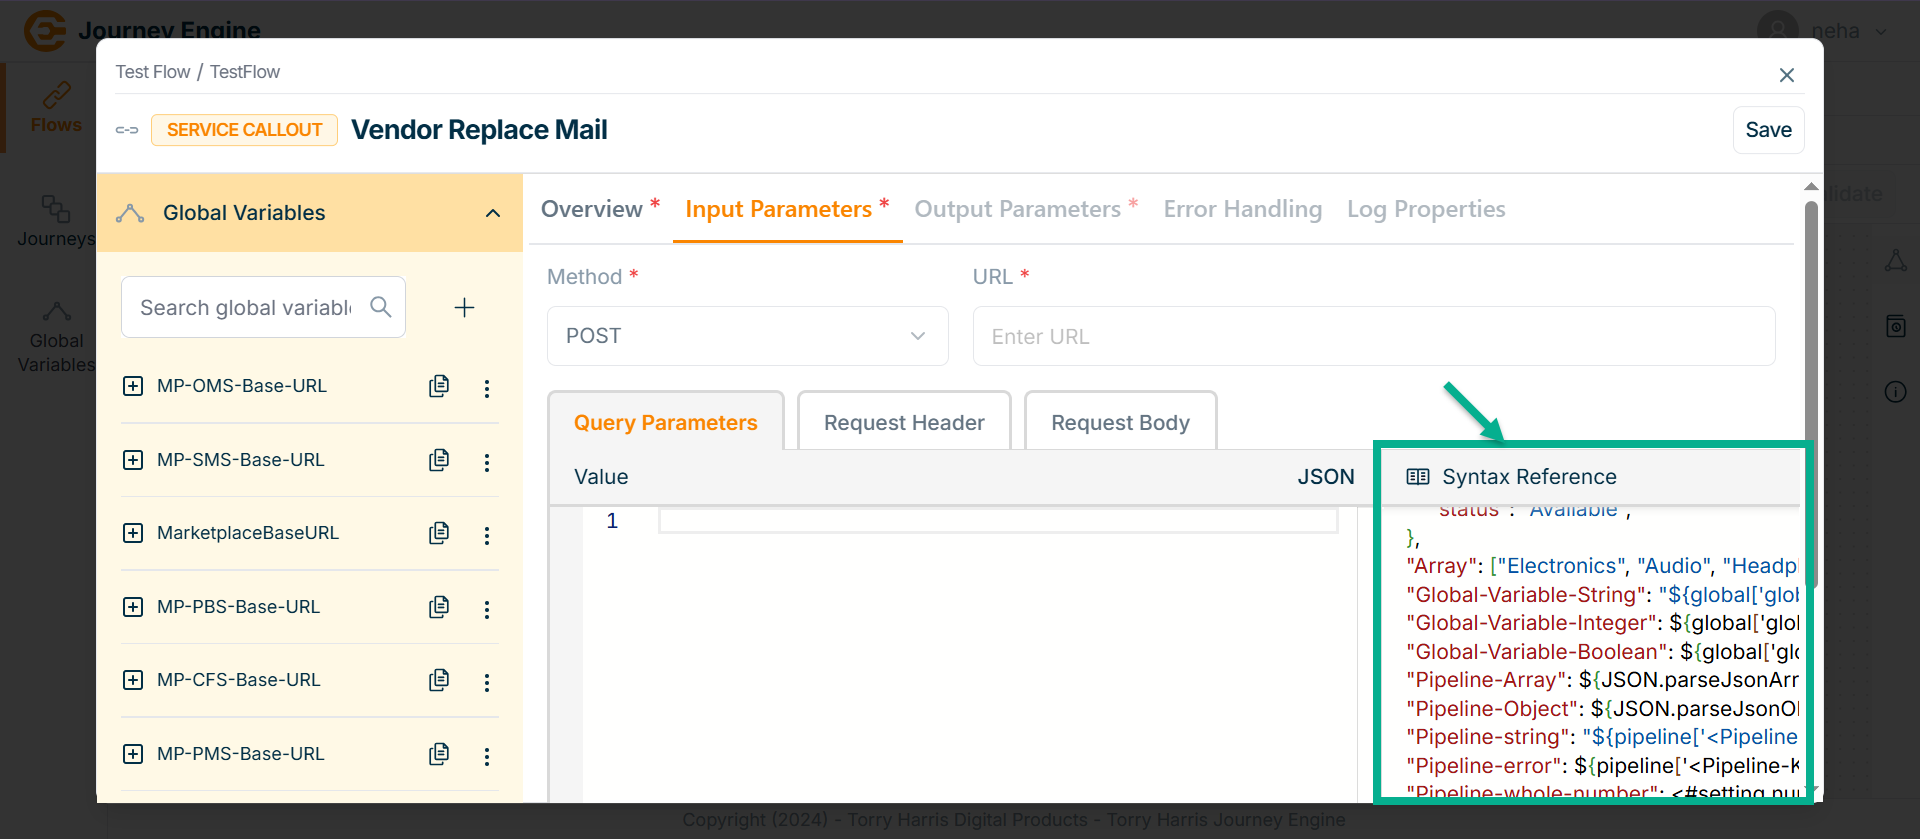
- Click on Syntax Reference.
In the Syntax Reference section, a Global Variables path parameter value is provided.
Users can copy and paste it directly to specify the exact required path.
-
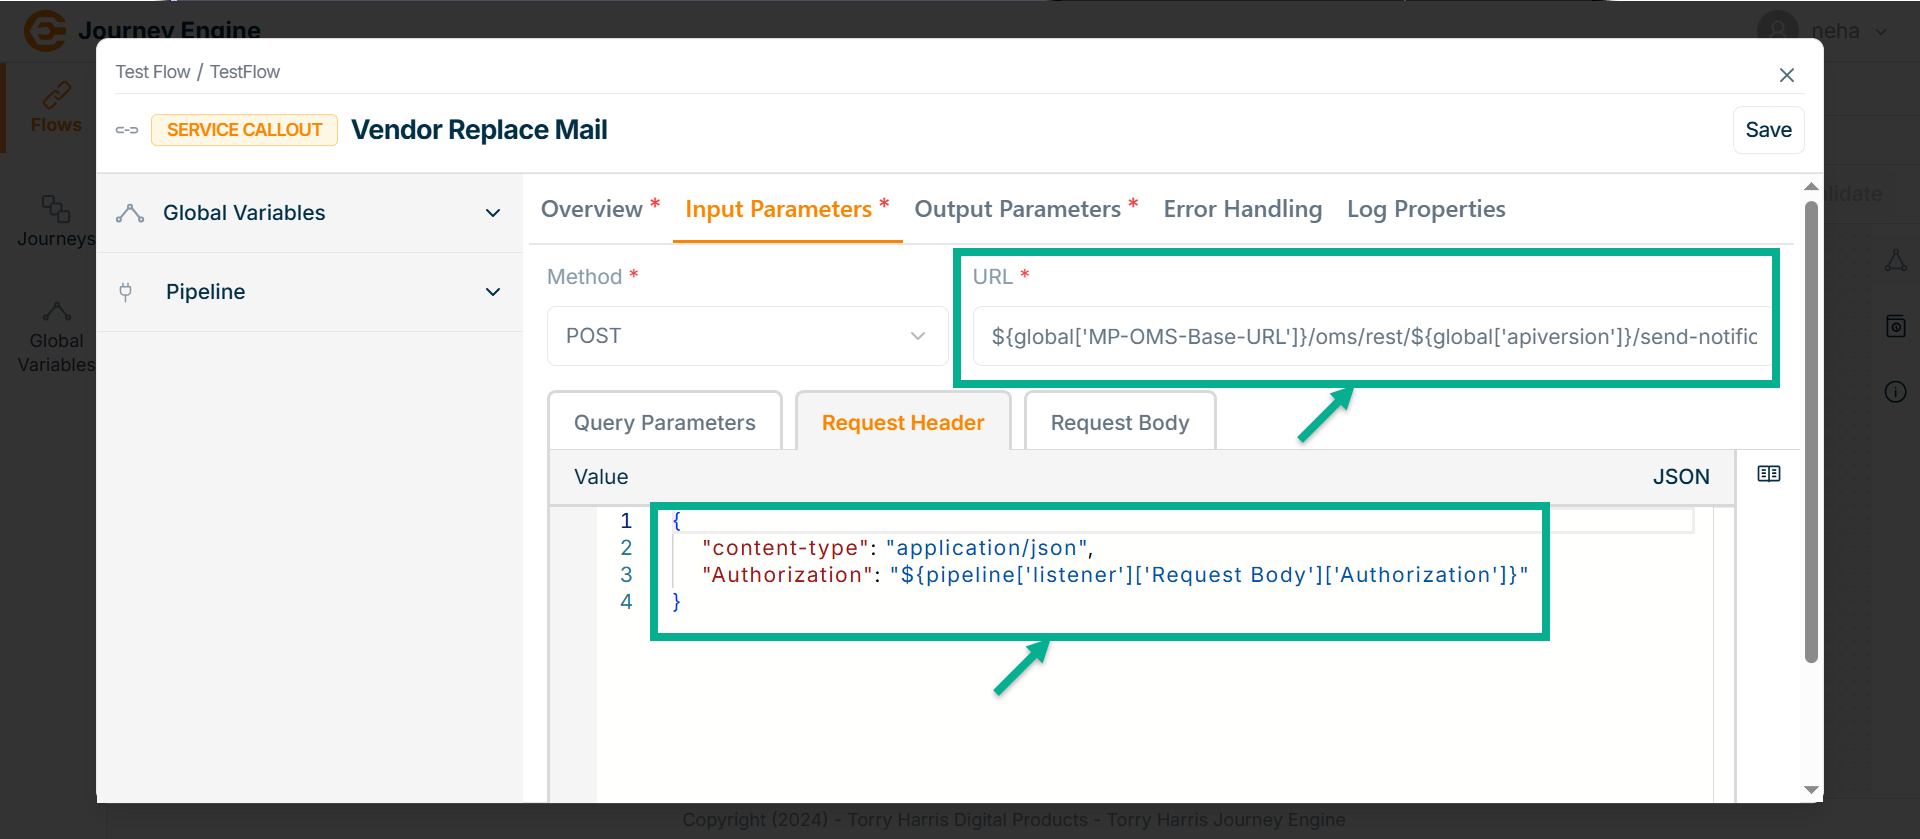
Copy the syntax into the field and modify it as needed based on your requirements.
-
Copy the exact path using the Global Variables section.
-
Under Query Params tab enter the value in JSON format if required.
-
Go to Request Header tab.
-
Enter Value in JSON format by using pipeline.
-
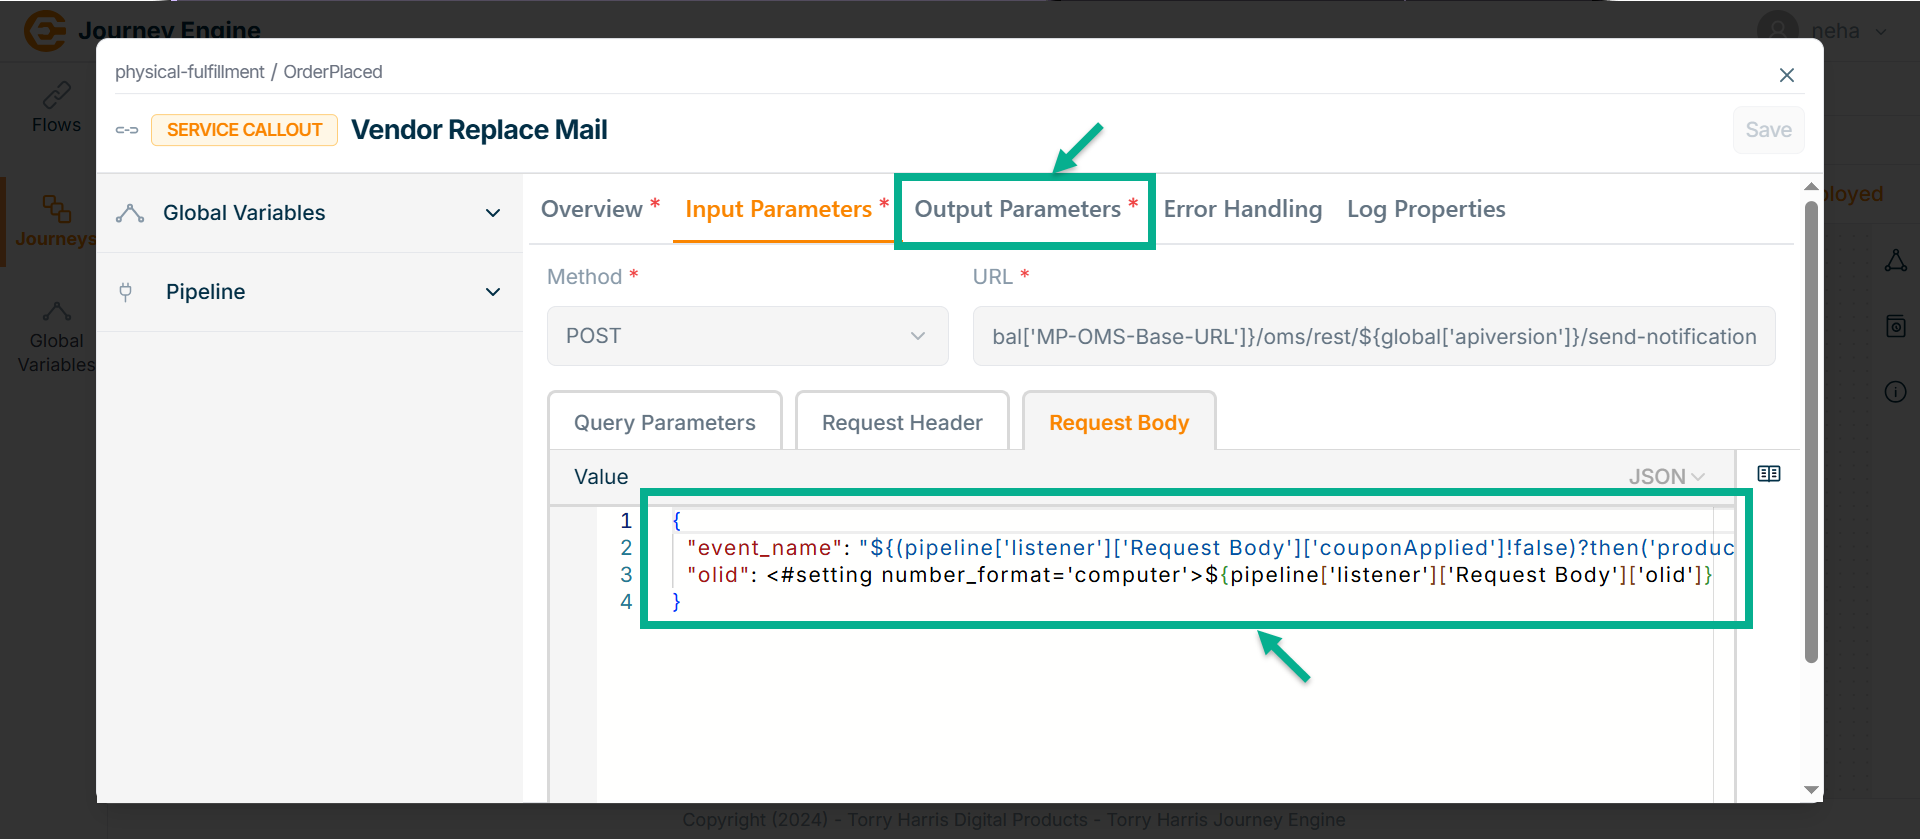
Go to Request Body tab.
-
Enter Value in JSON format by using pipeline.
-
Click Save.
-
Go to Output Parameter.
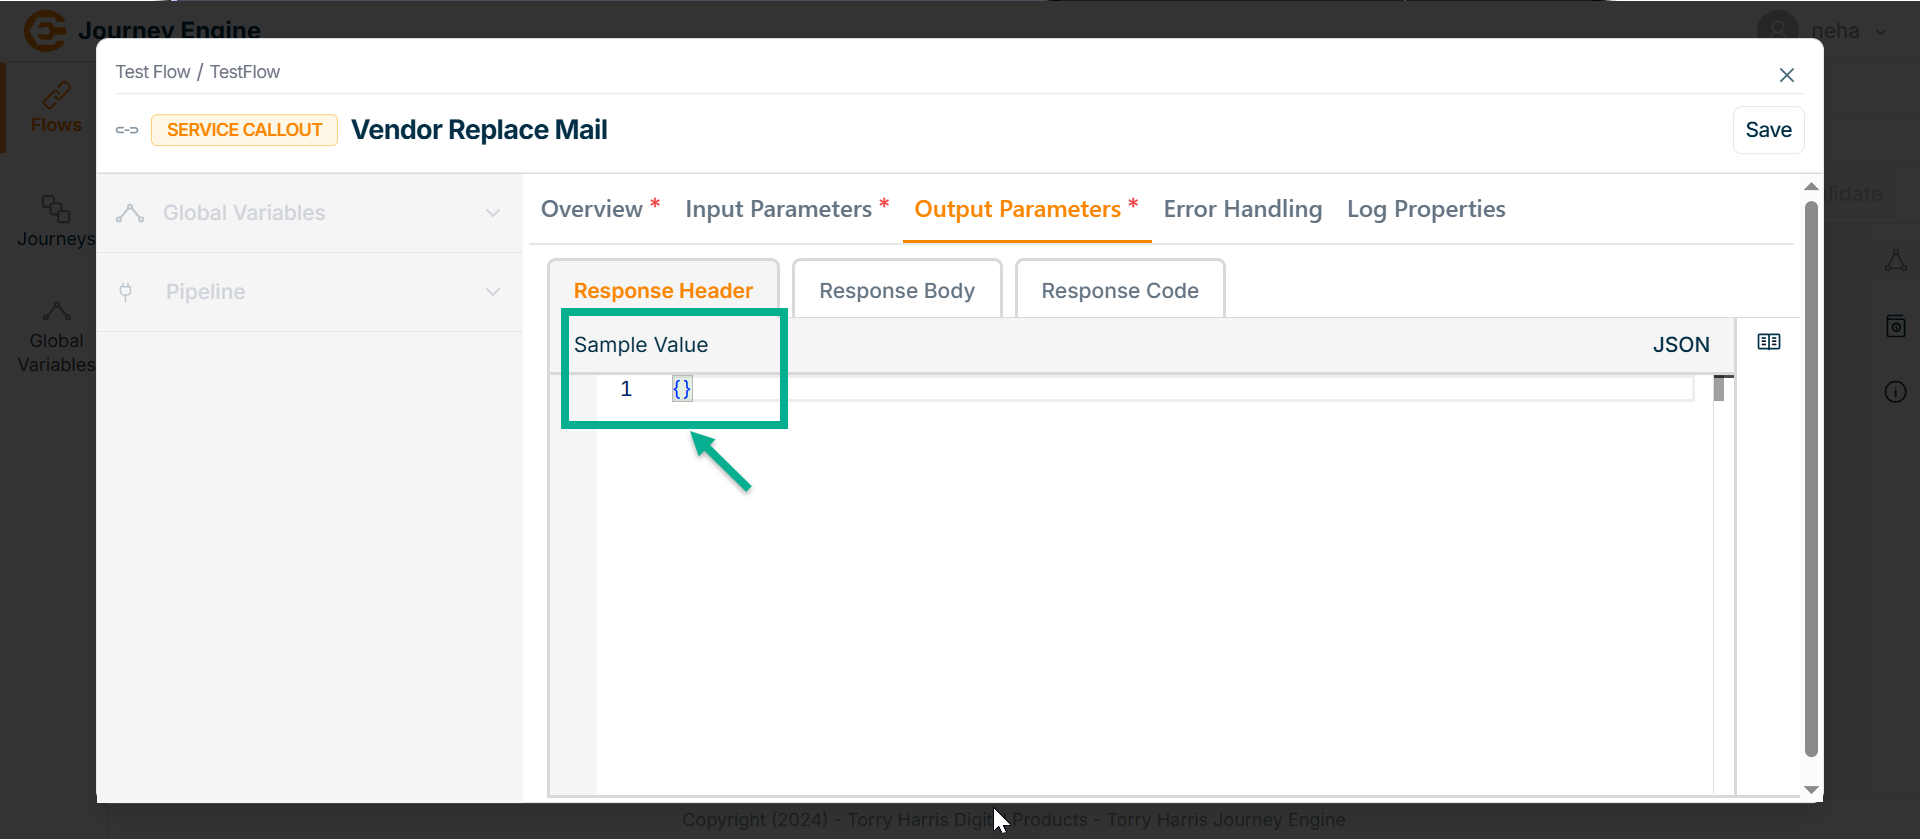
-
Under Response Header enter Sample Value in JSON format.
-
Go to Response Body tab.
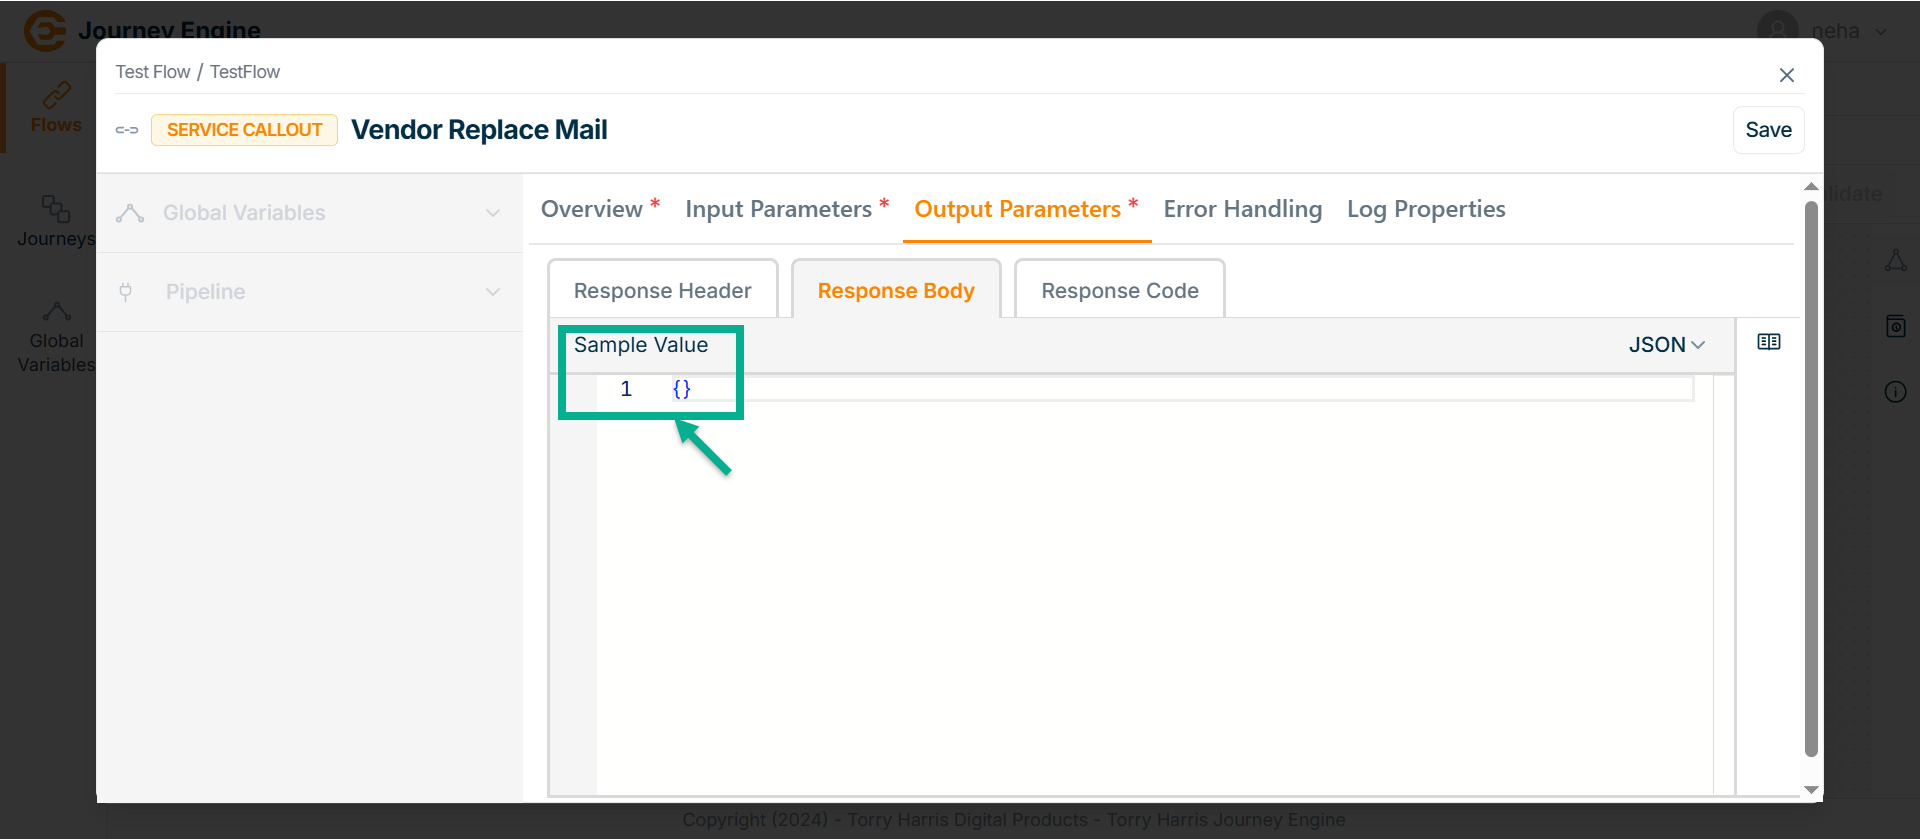
-
Enter Sample Value in JSON format.
-
Go to Response Code tab.
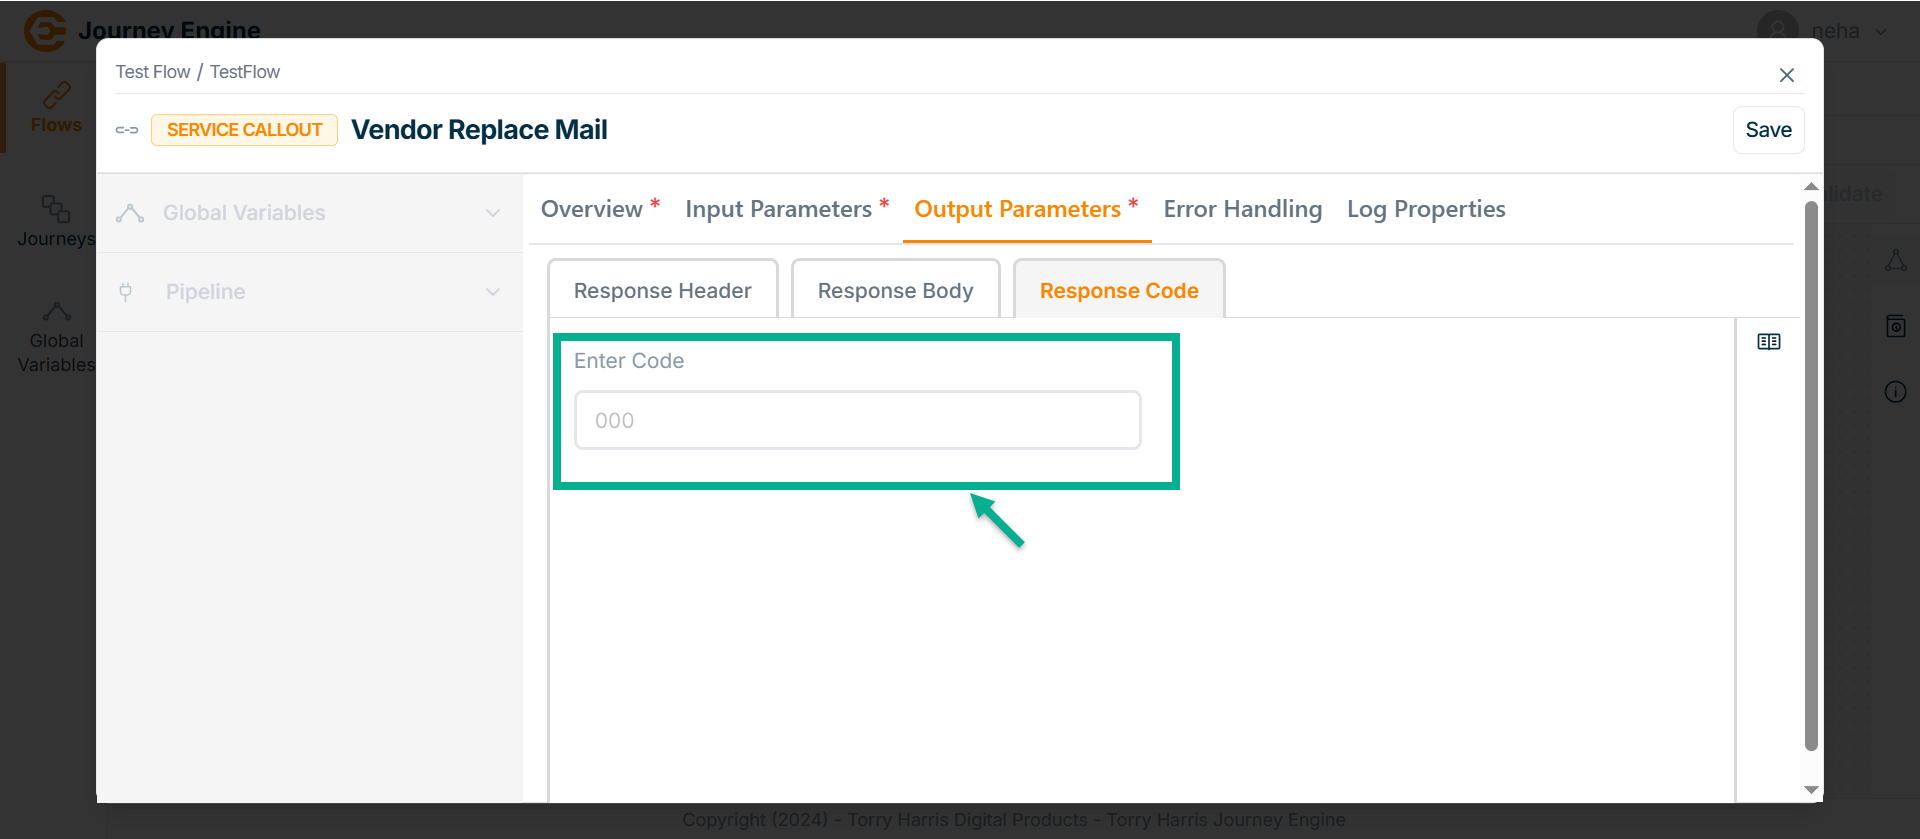
-
Enter Code.
-
Click Save.
-
Go to Error Handling tab.
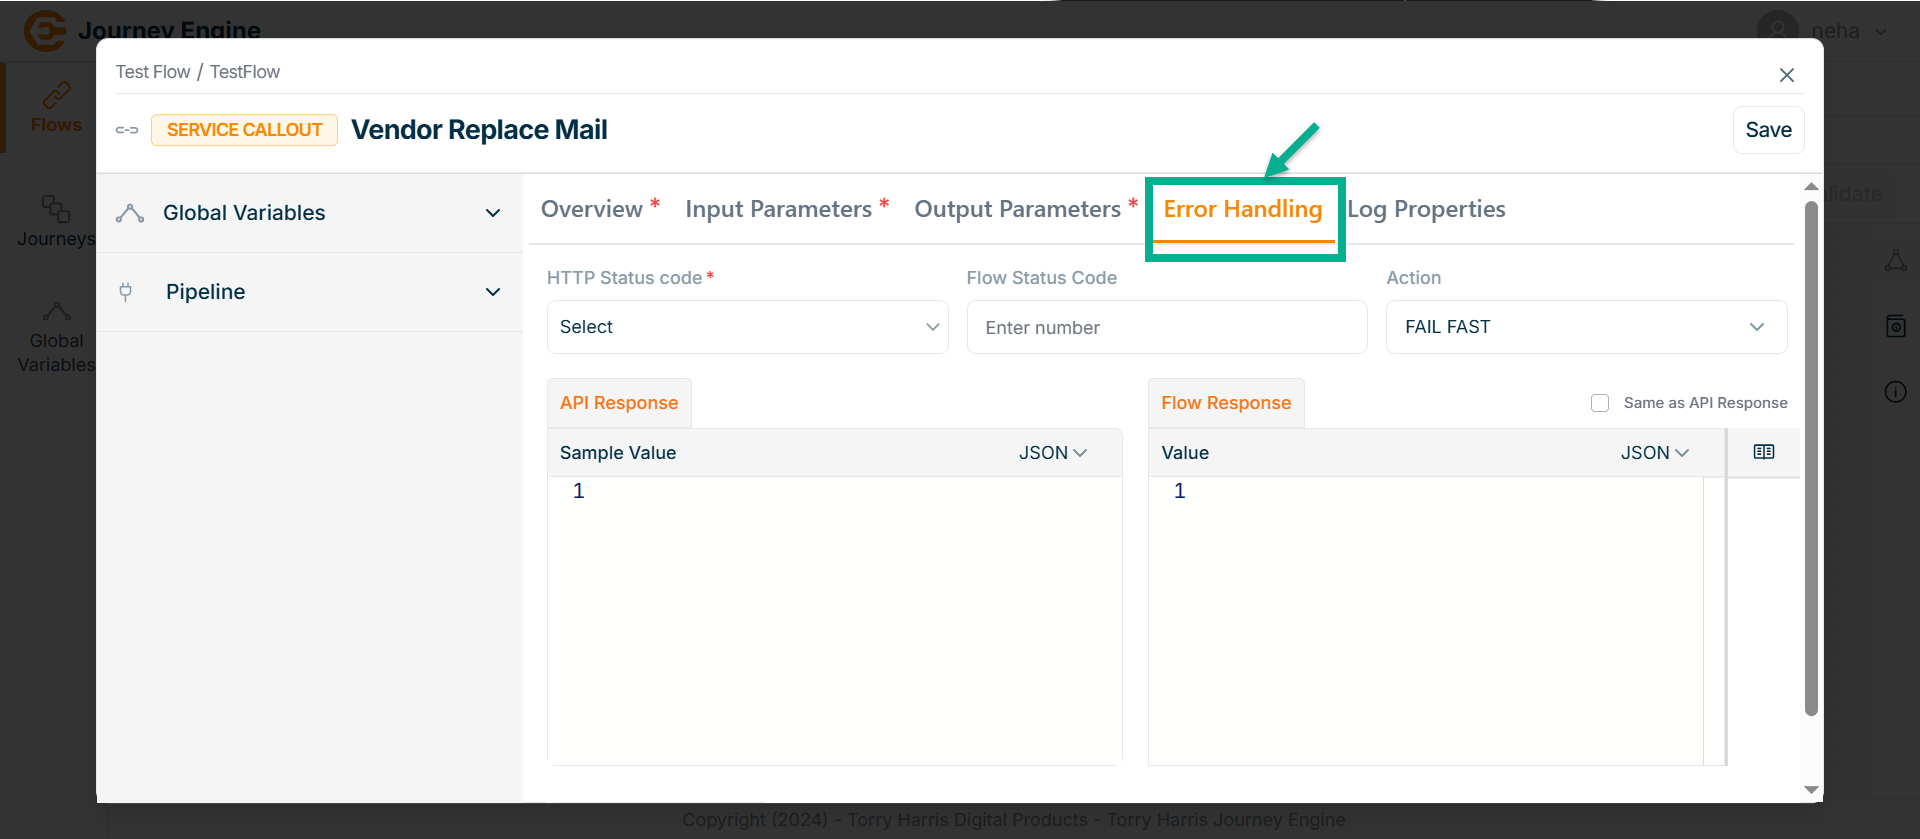
-
Click Save.
-
Go to Log Properties tab.
-
Select the Log level for input parameter from the dropdown.
-
Select Input parameters from the dropdown.
-
Select the Log level for output parameter from the dropdown.
-
Select Output parameters from the dropdown.
-
Enable the Node entry and exit.
-
Select Log level for node entry and exit from the dropdown.
-
Click Save.
-
Click on Close button to close the Service Callout Node.
HTTP Responder Node
- Click on Nodes icon.
-
Click and drag the HTTP Responder Node into the canvas.
-
Click on the Edit icon.
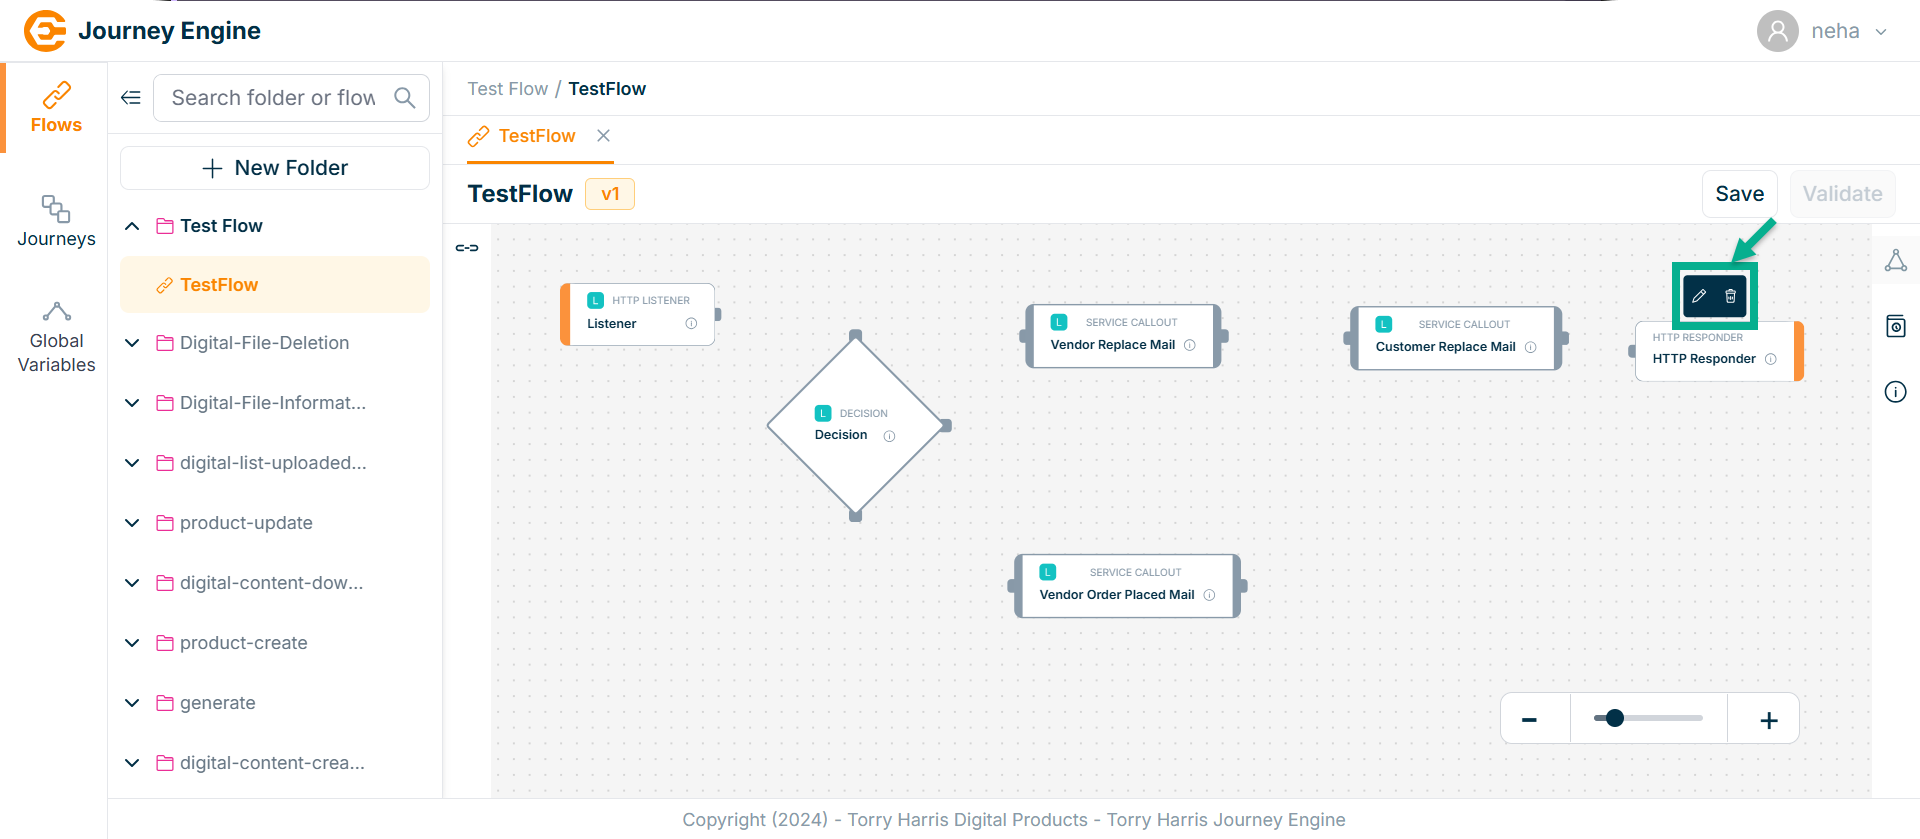
Click Delete to delete the node.
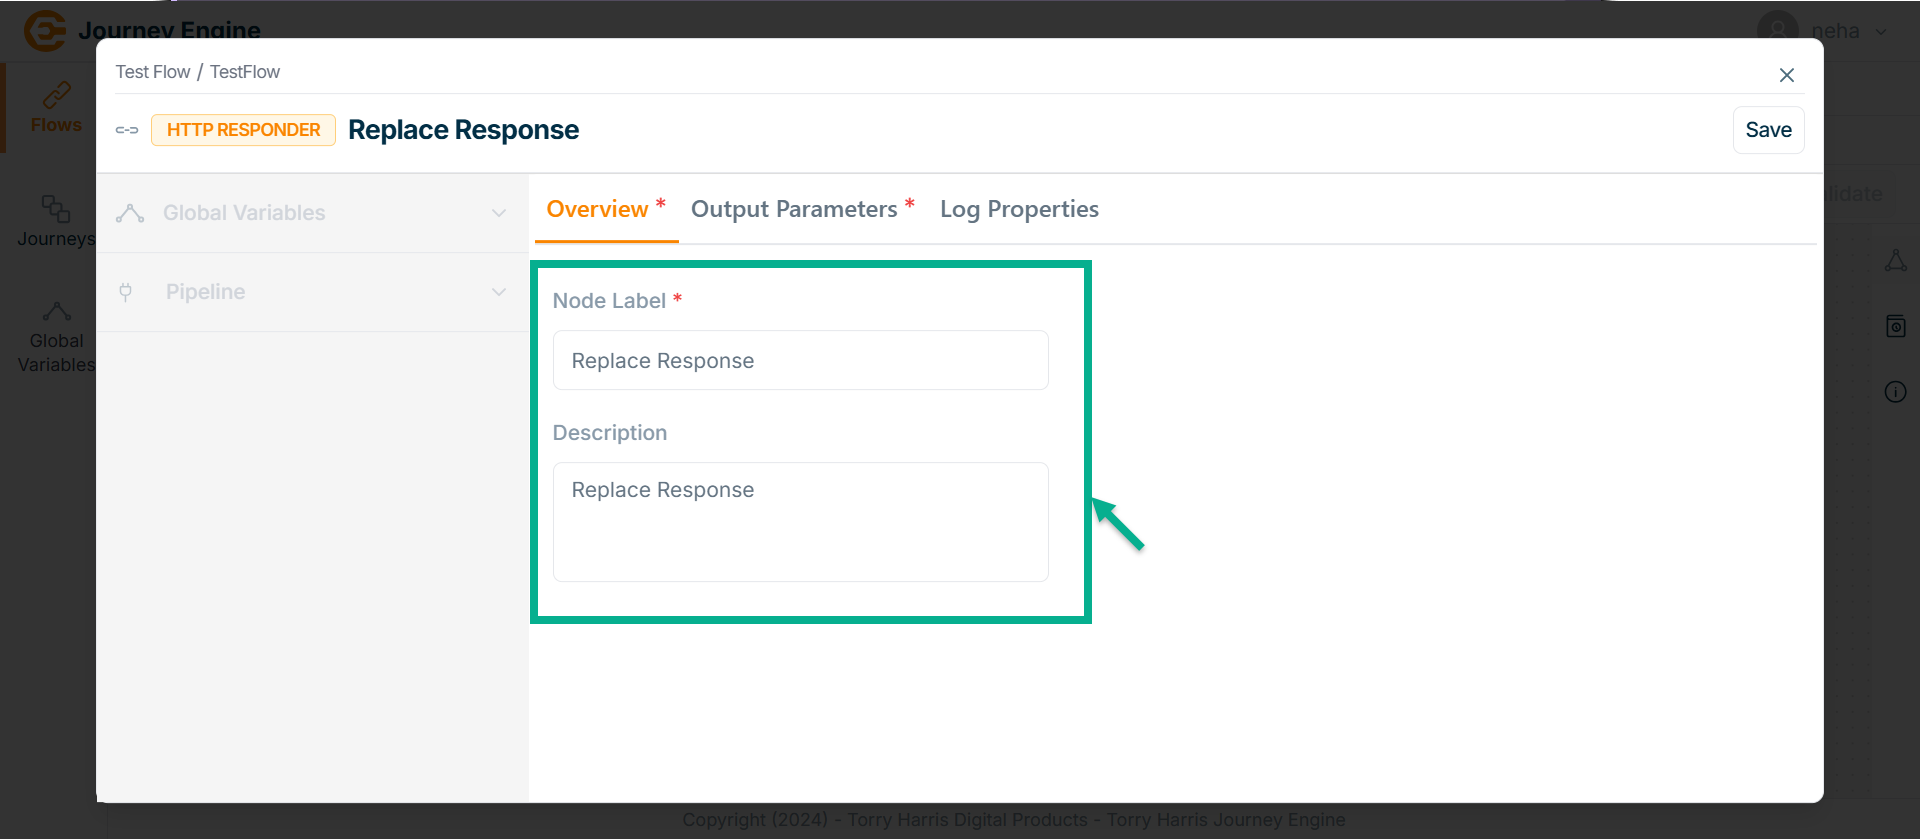
The HTTP Responder screen apperas as shown below
-
Enter Node Label and Description.
-
Go to Output Parameters.
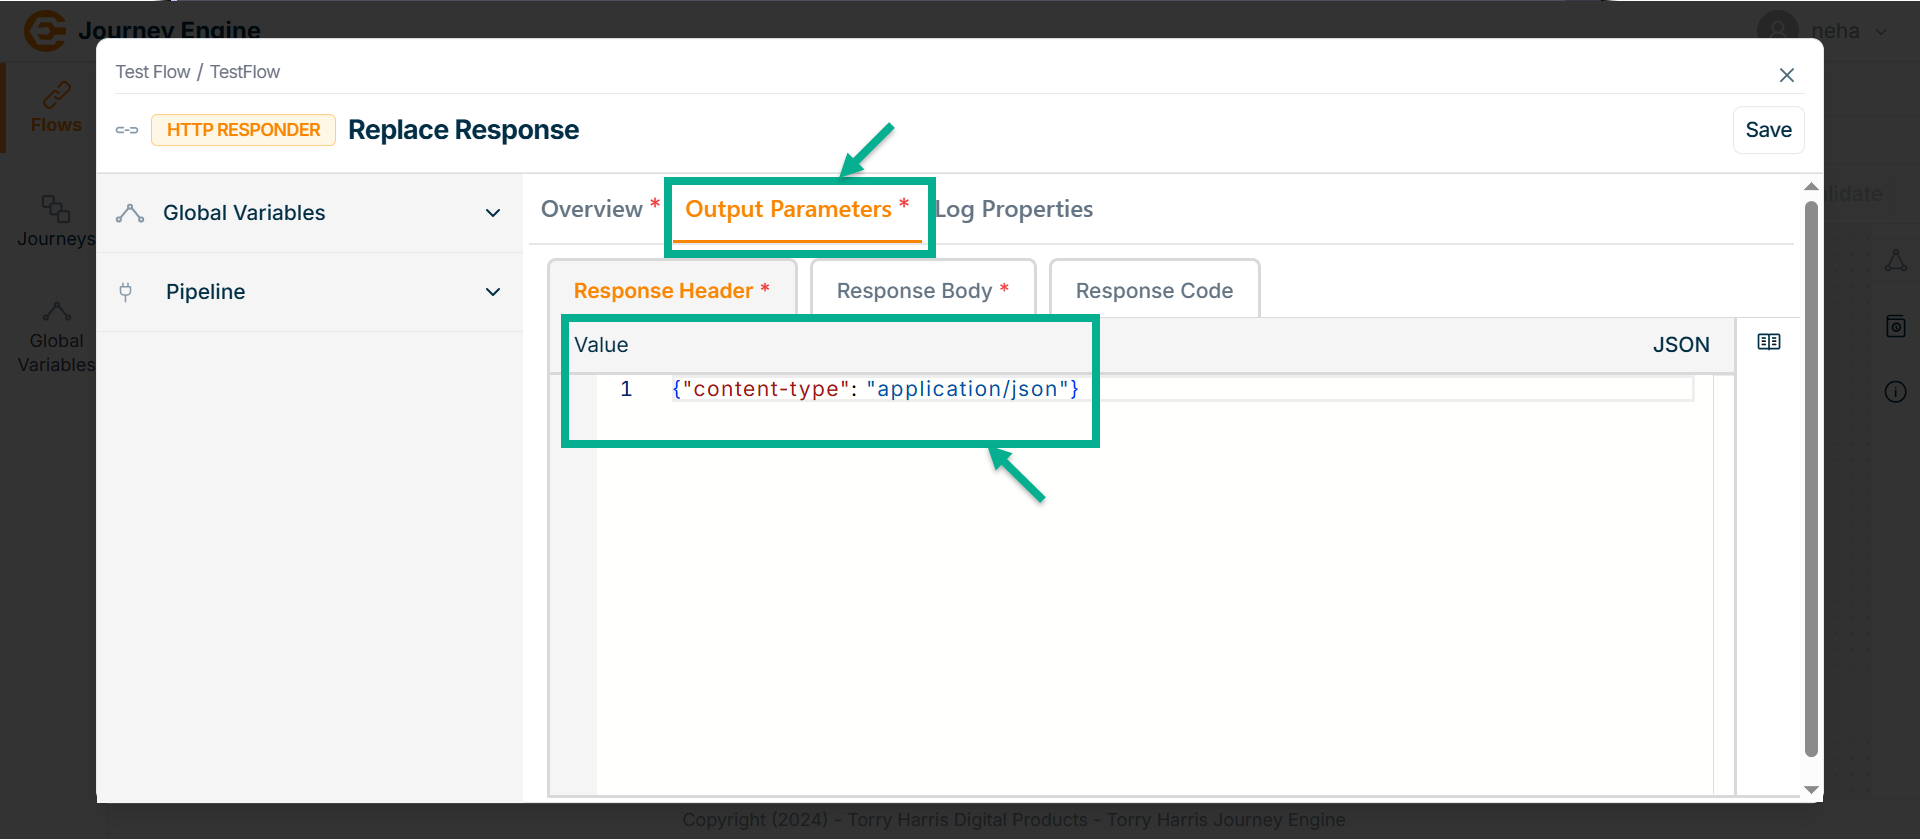
-
Under Response Header enter the Value in JSON format.
-
Go to Response Body tab.
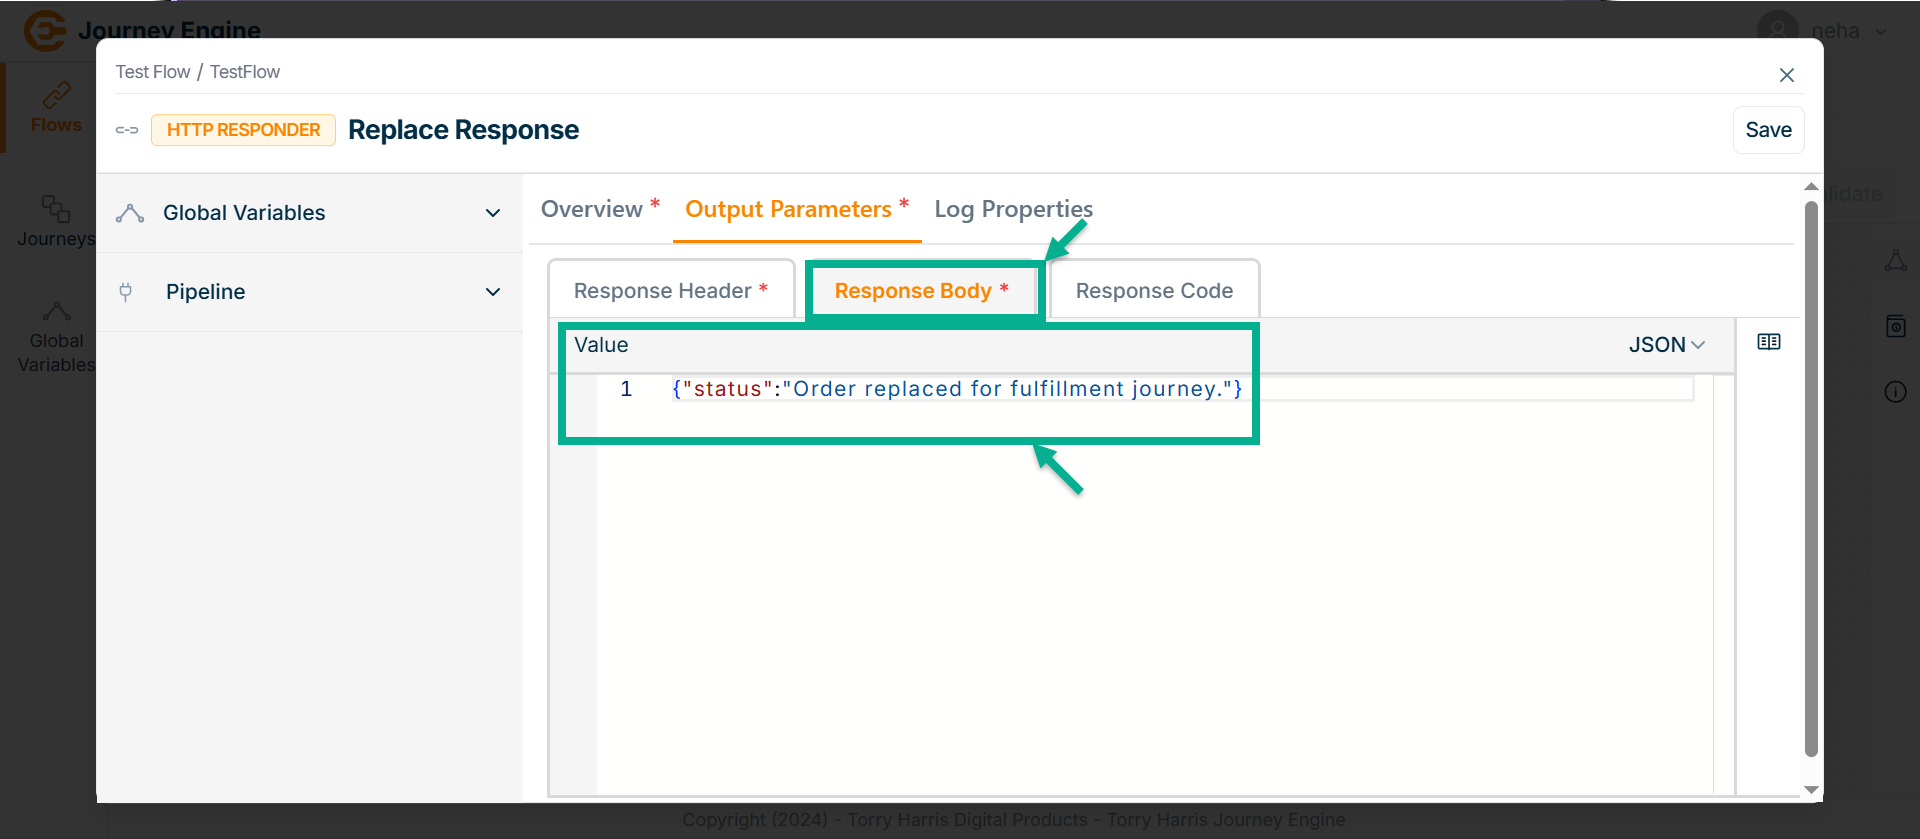
-
Enter Value in JSON format.
-
Got to Response Code tab.
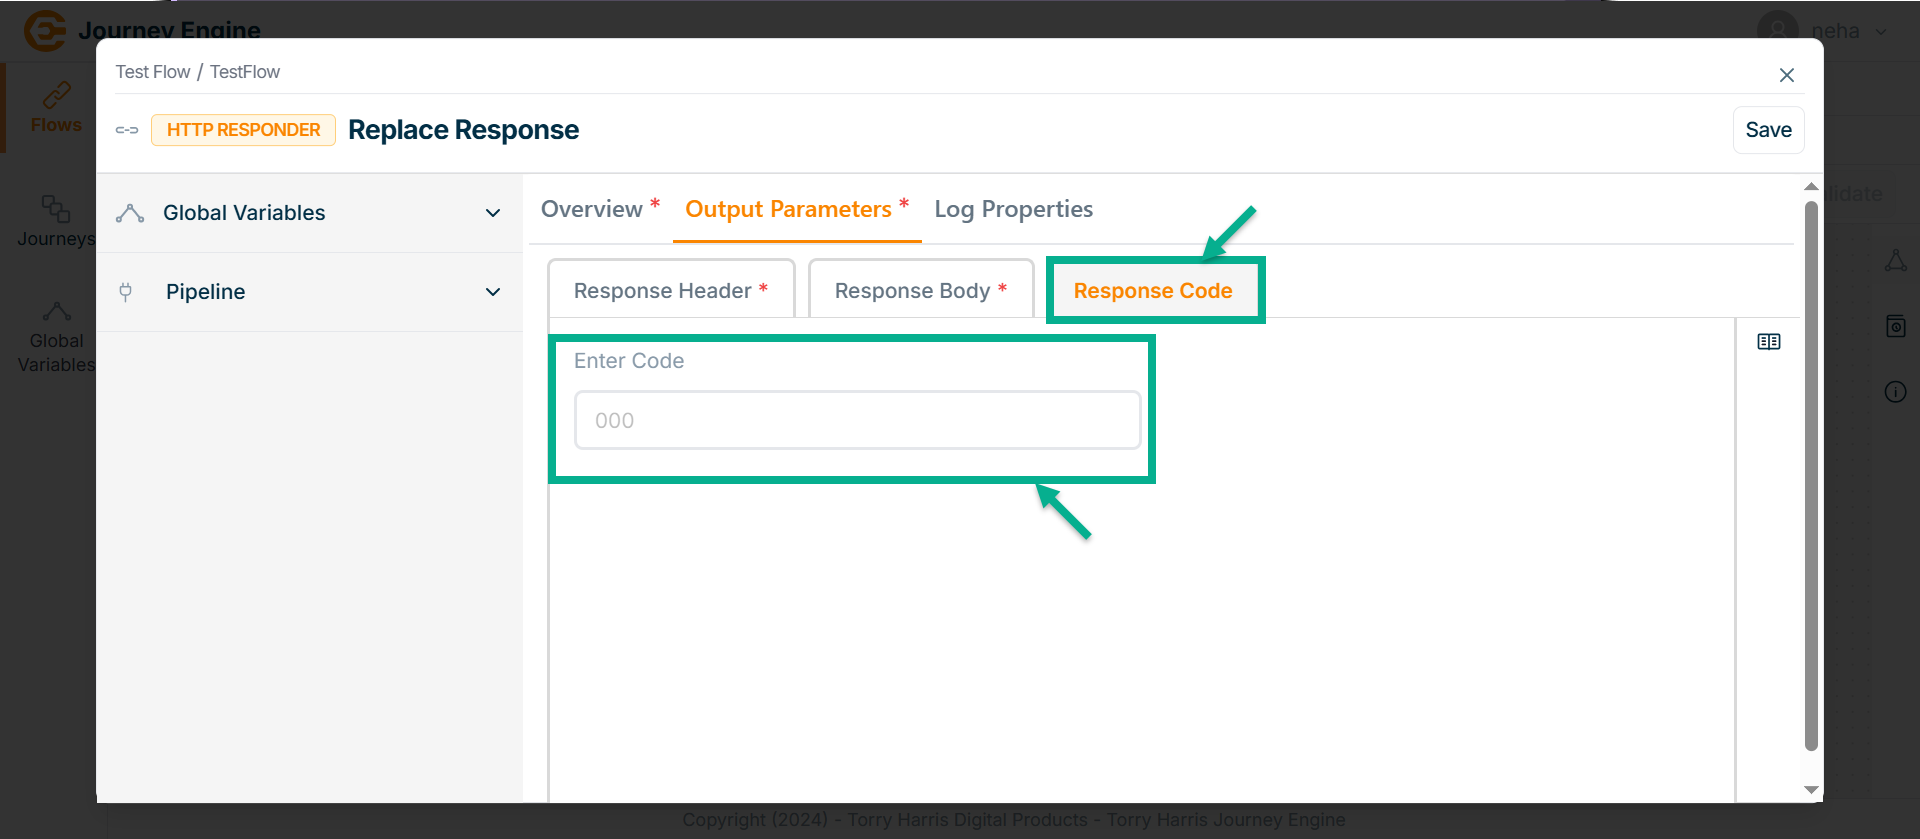
-
Enter Code.
-
Click Save.
-
Go to Log Properties tab.
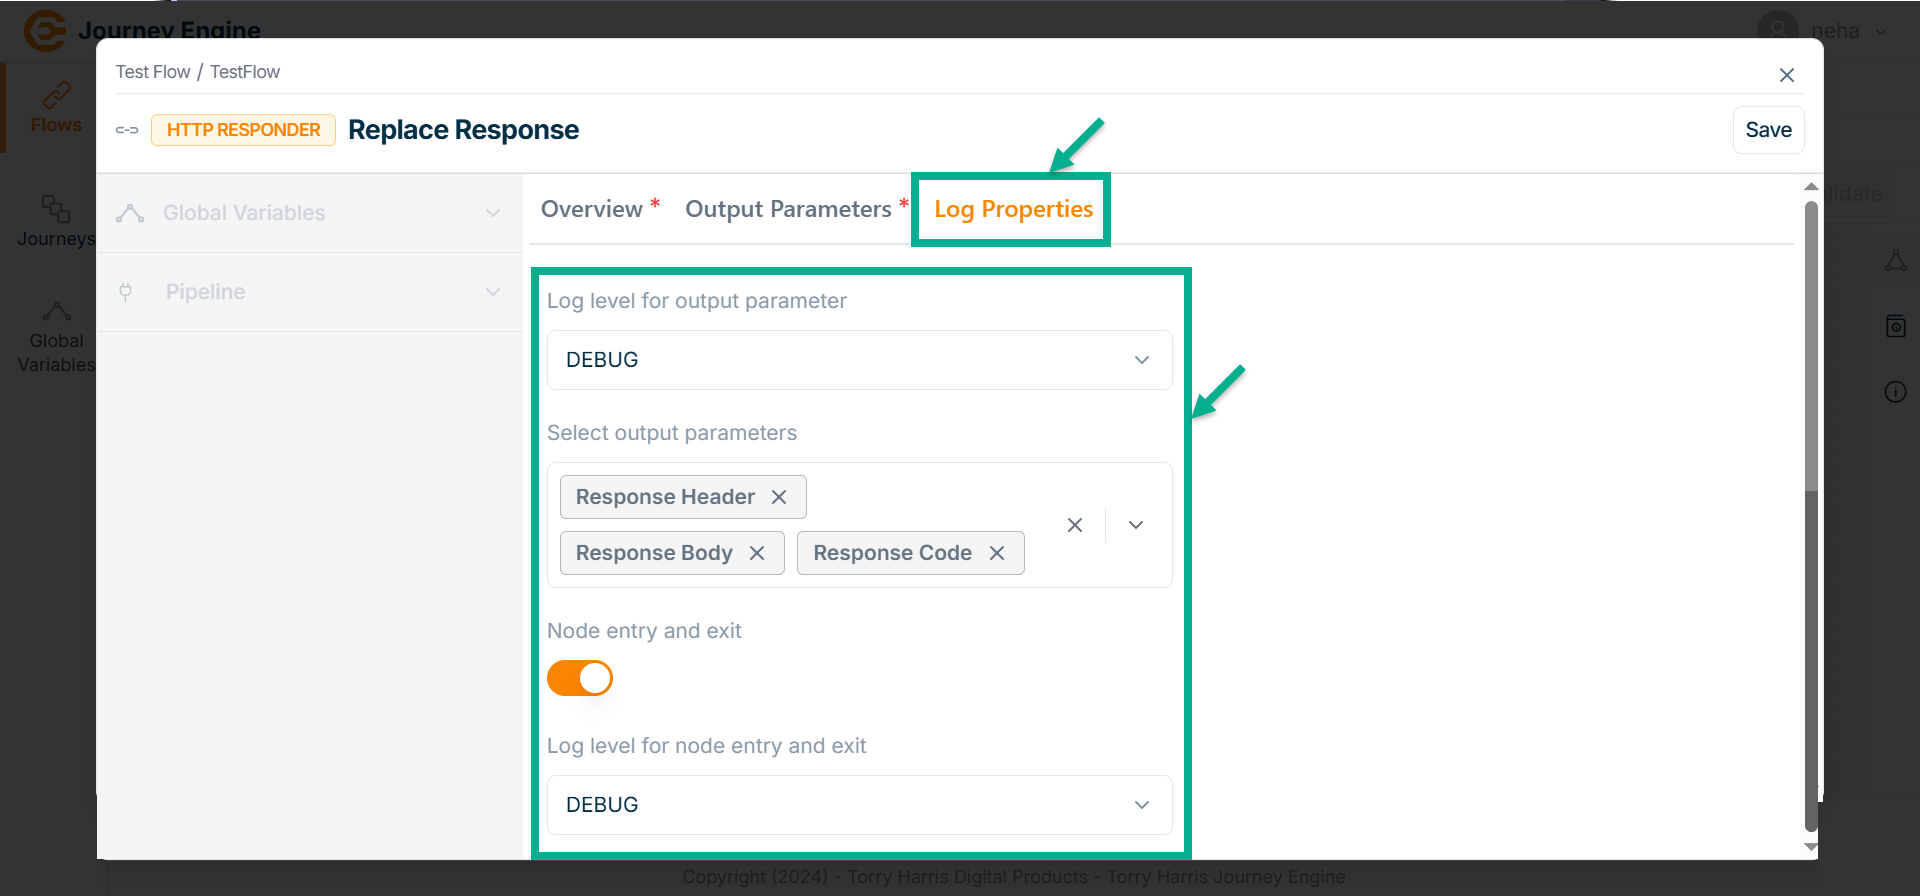
-
Select the Log level for output parameter from the dropdown.
-
Select Output parameters from the dropdown.
-
Enable the Node entry and exit.
-
Select Log level for node entry and exit from the dropdown.
-
Click Save.
-
Click on Close button to close the Service Callout Node.
Connecting the Nodes
Connecting nodes means linking components in a flow to define the sequence and logic of data or actions.
- Hover over the Node.
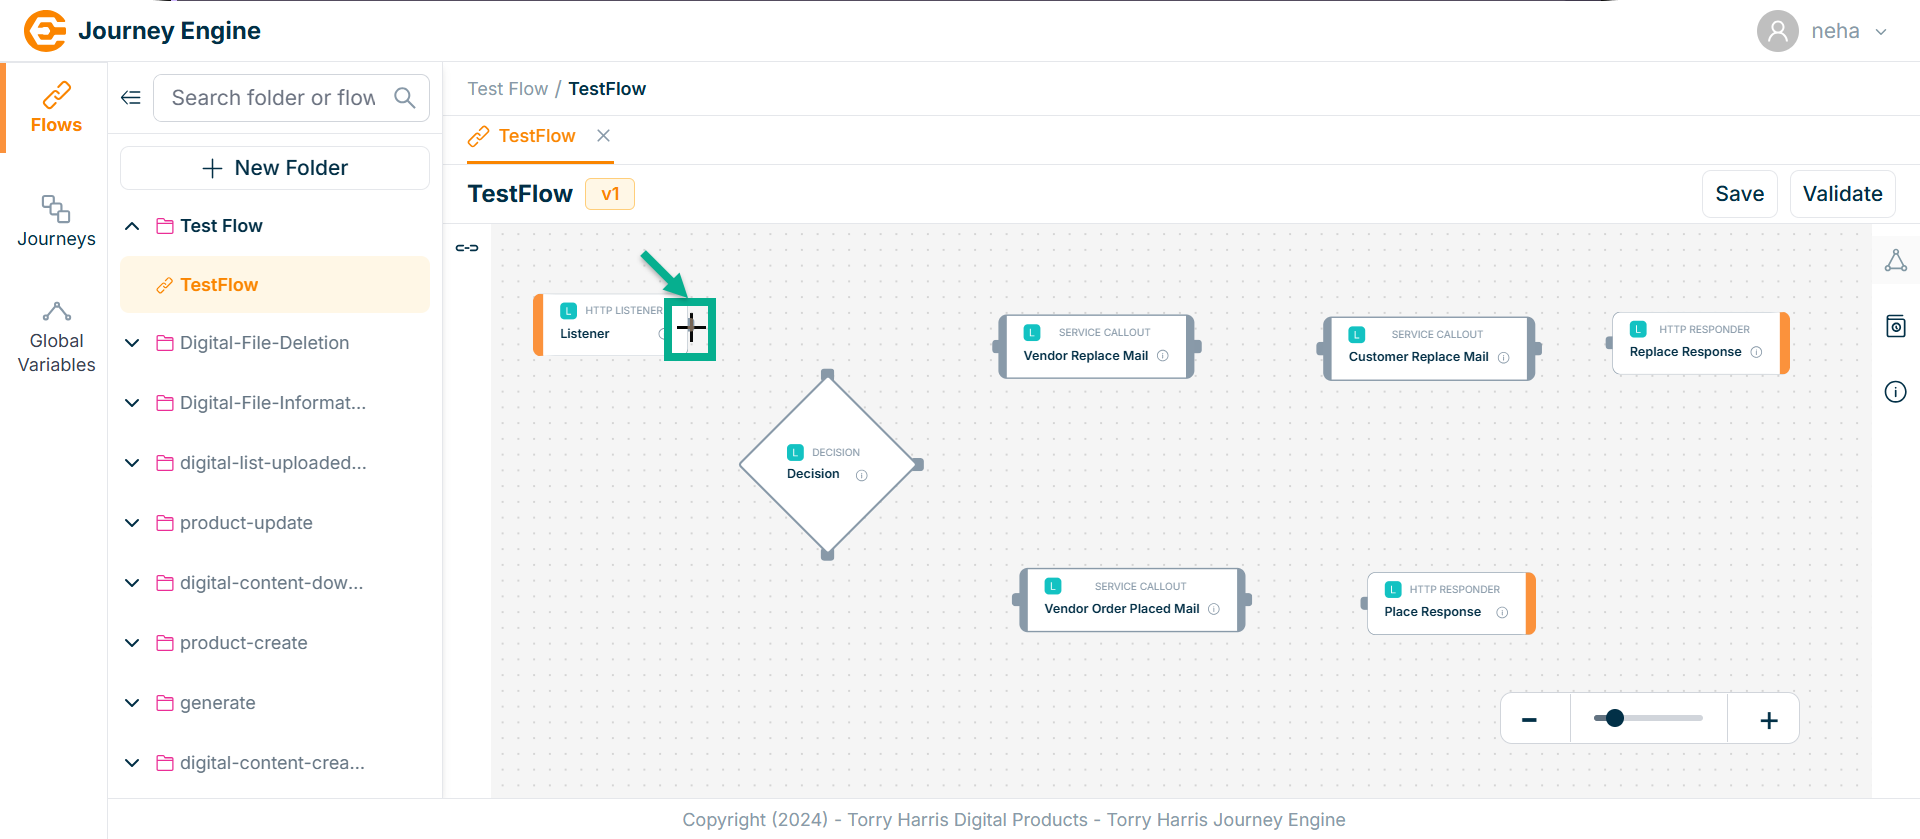
-
Click and hold the plus (+) icon.
-
Drag the line to the next node you want to connect.
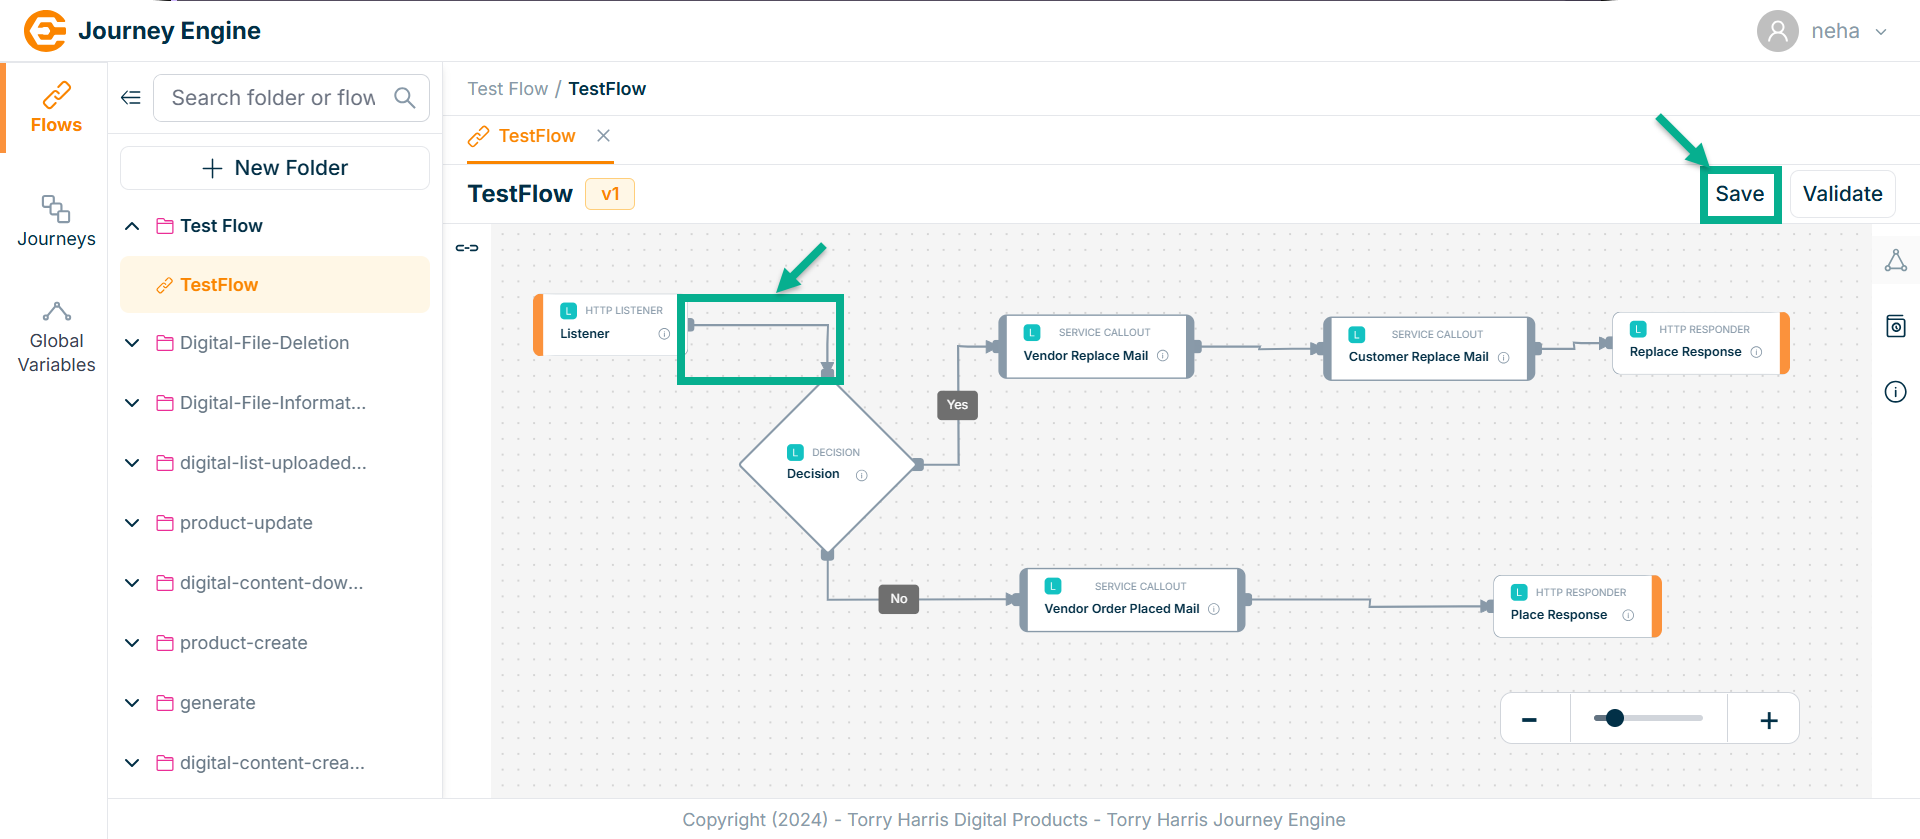
-
Release the mouse once the line reaches the target node.
-
Click on Save.
On saving, the confirmation message appears as shown below.

Validating the Flow
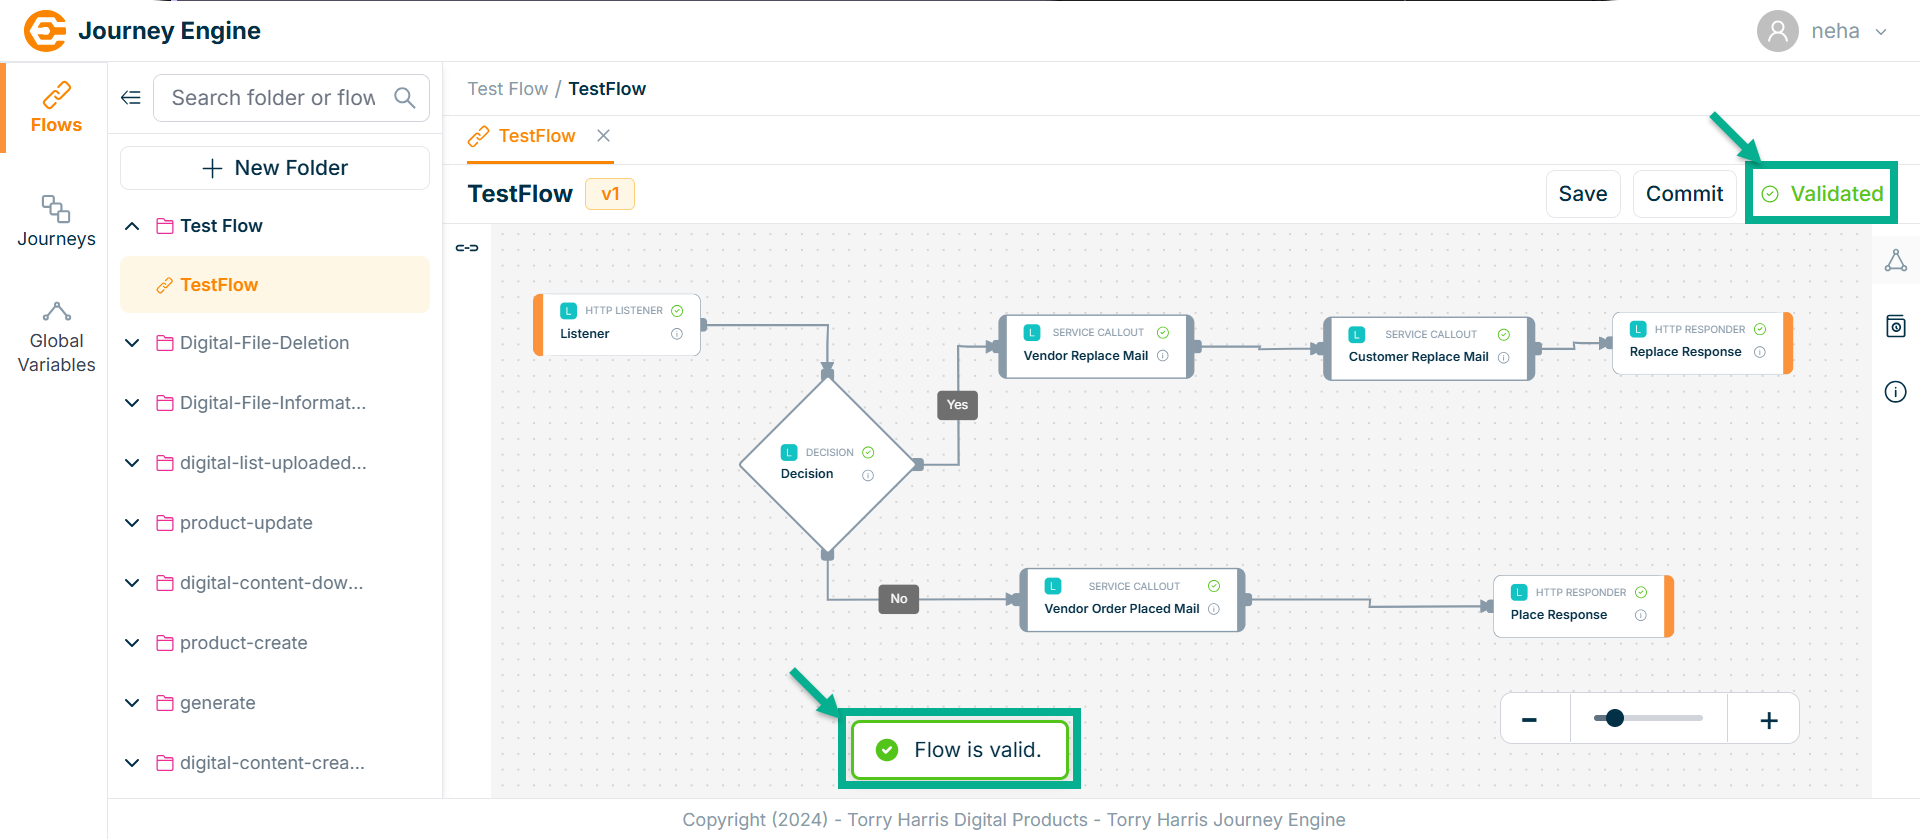
- Click on Validate.
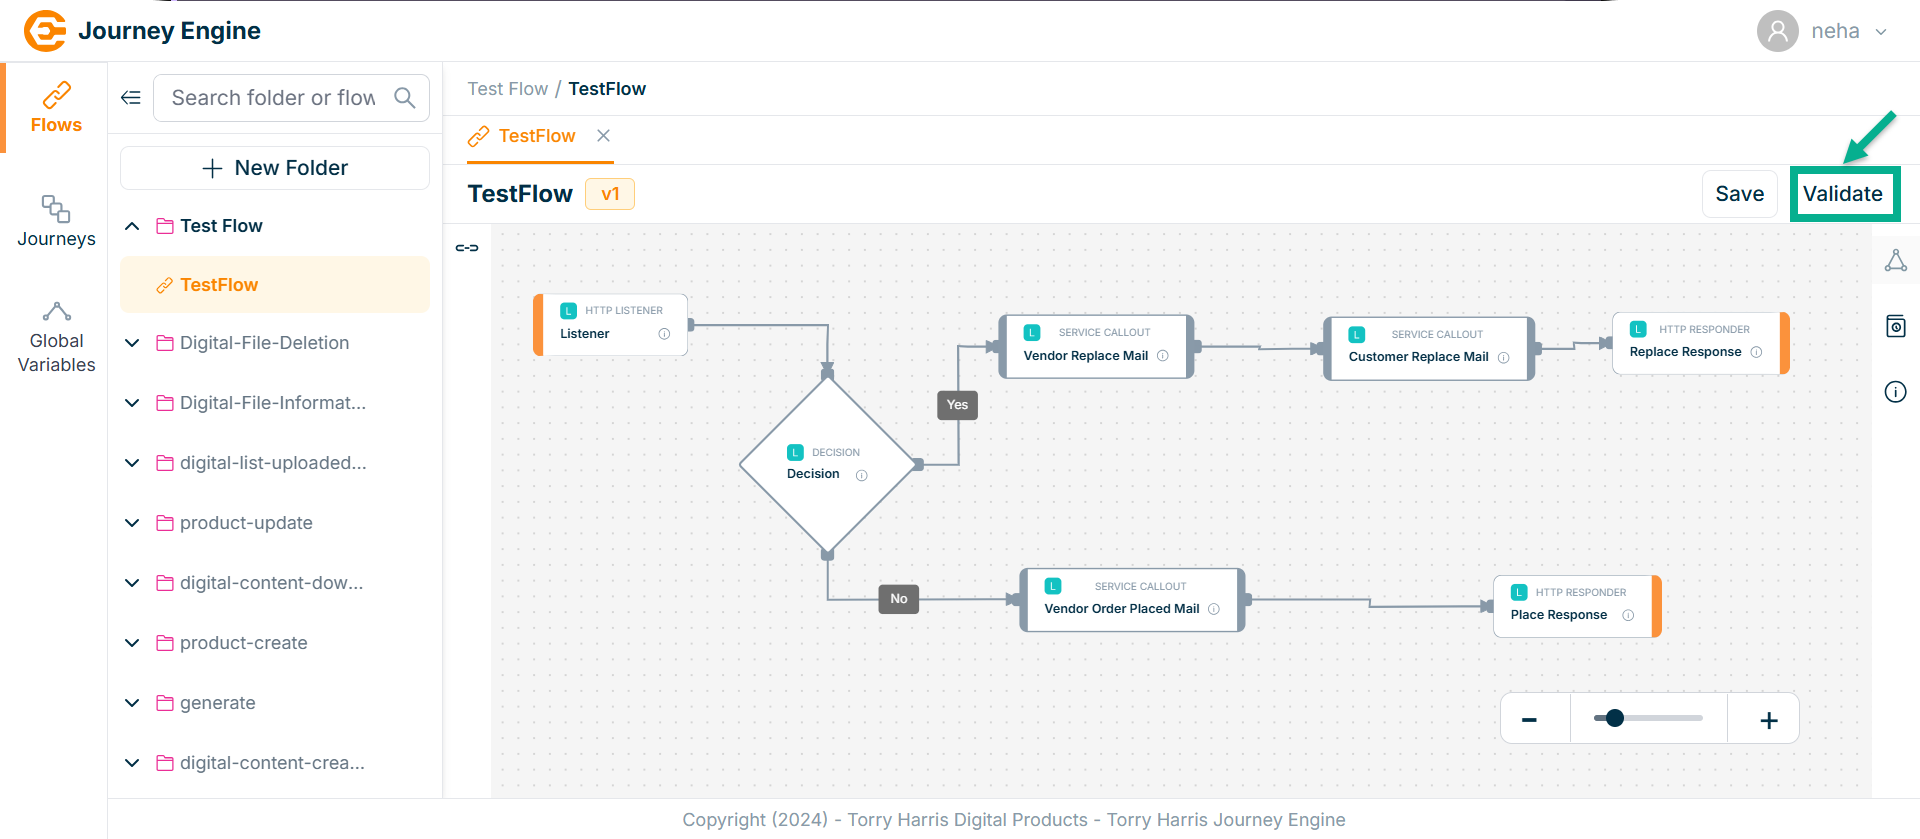
On validating, the confirmation message appears as shown below.
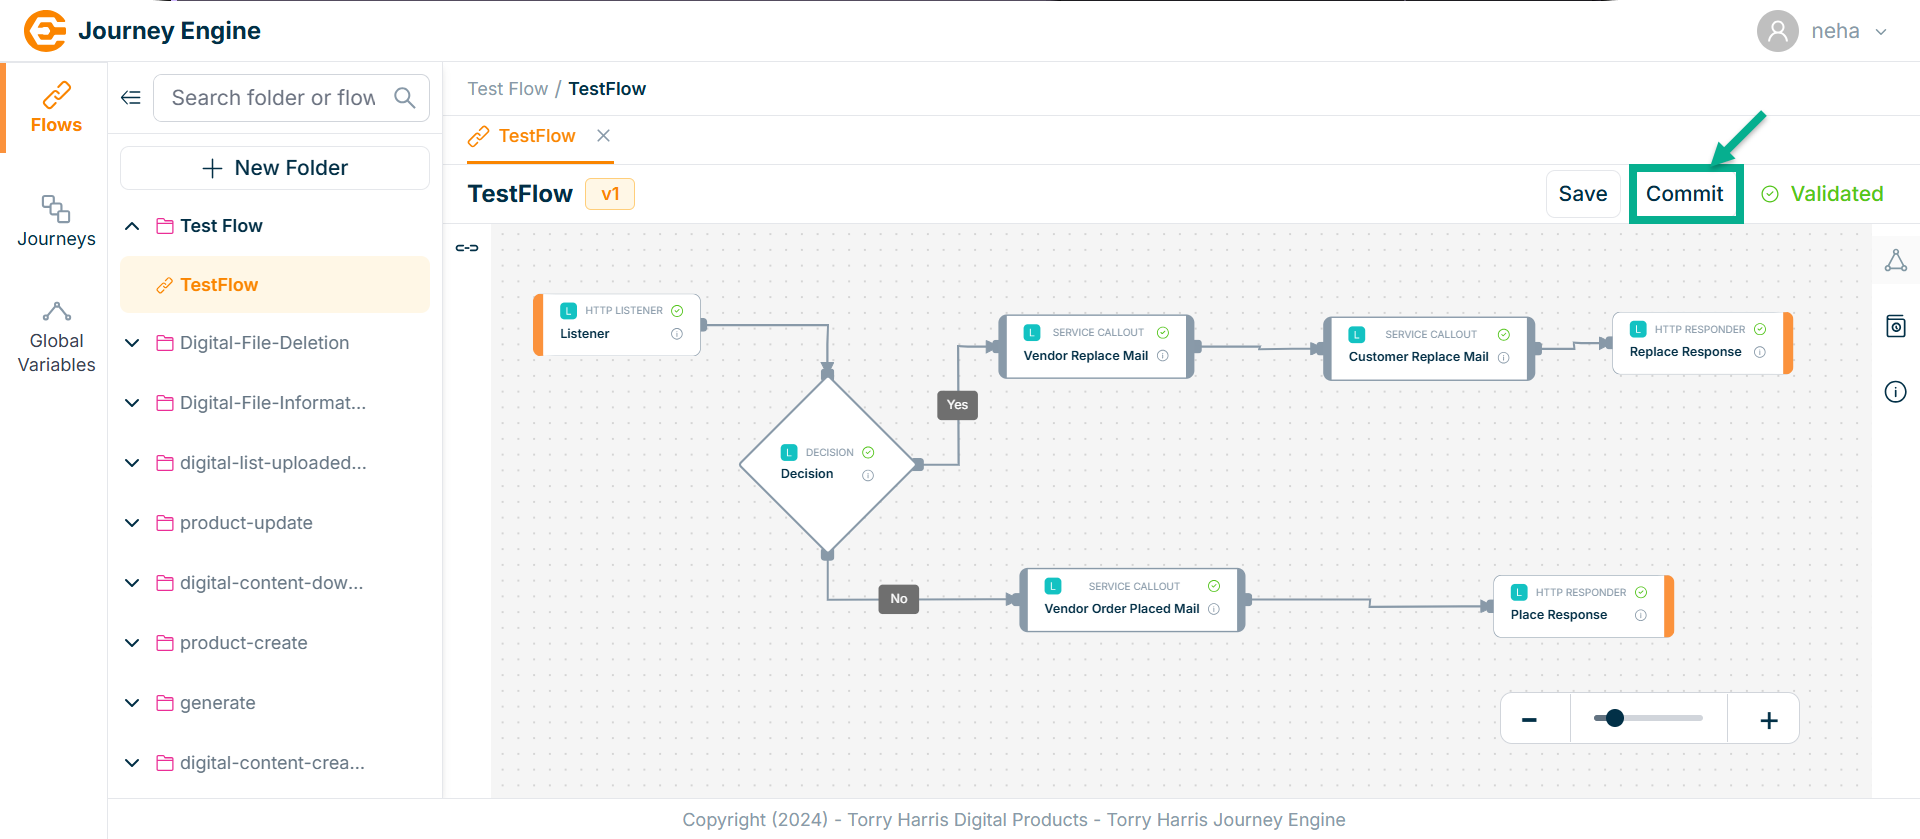
Committing the Flow
Once the flow is committed, the nodes can no longer be edited. To make any changes, a new version must be created on top of the deployed one.
- Click on Commit.
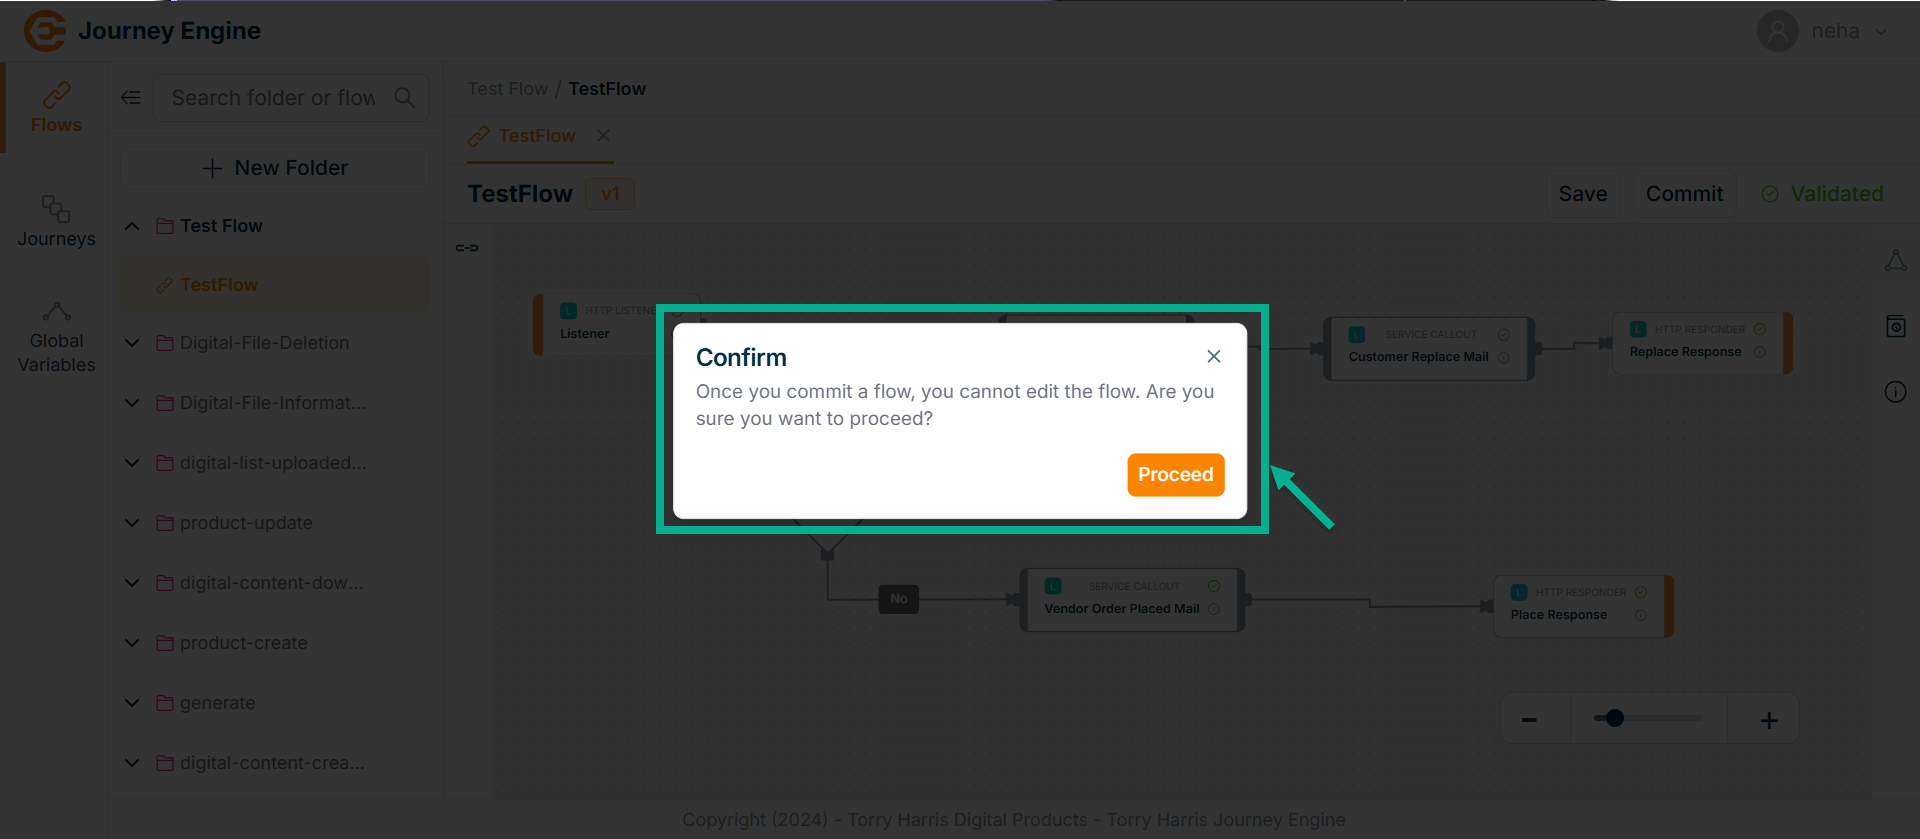
On committing, confirm popup appear as shown below.
- Click on Proceed.
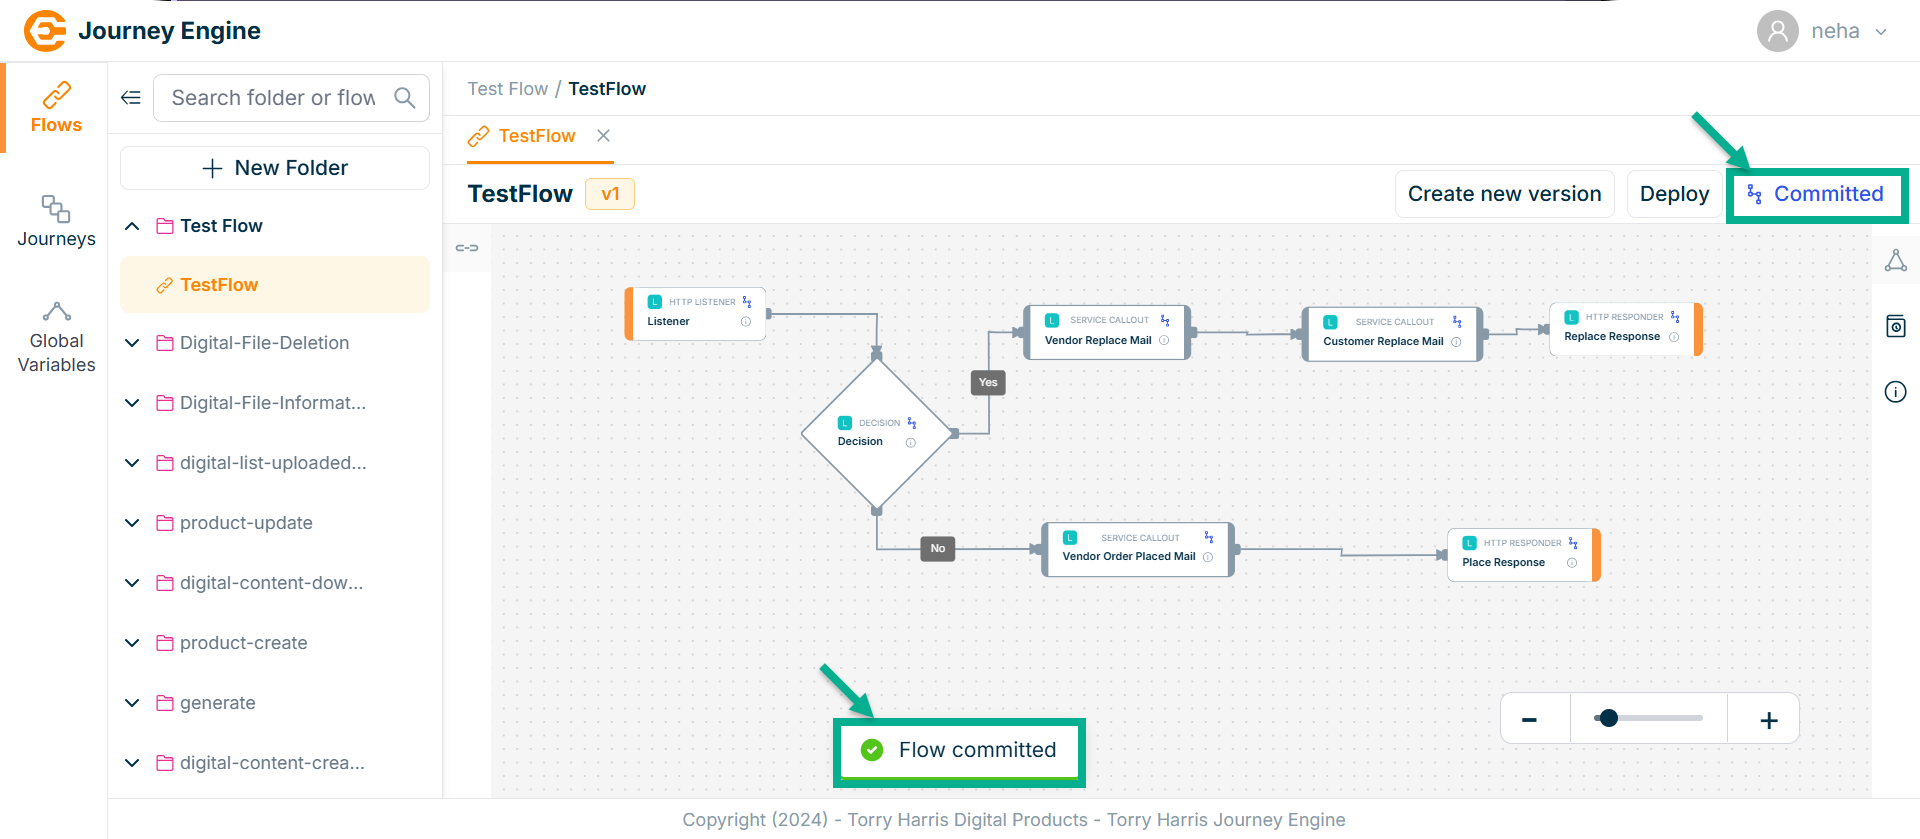
On proceeding, the confirmation message appears as shown below.
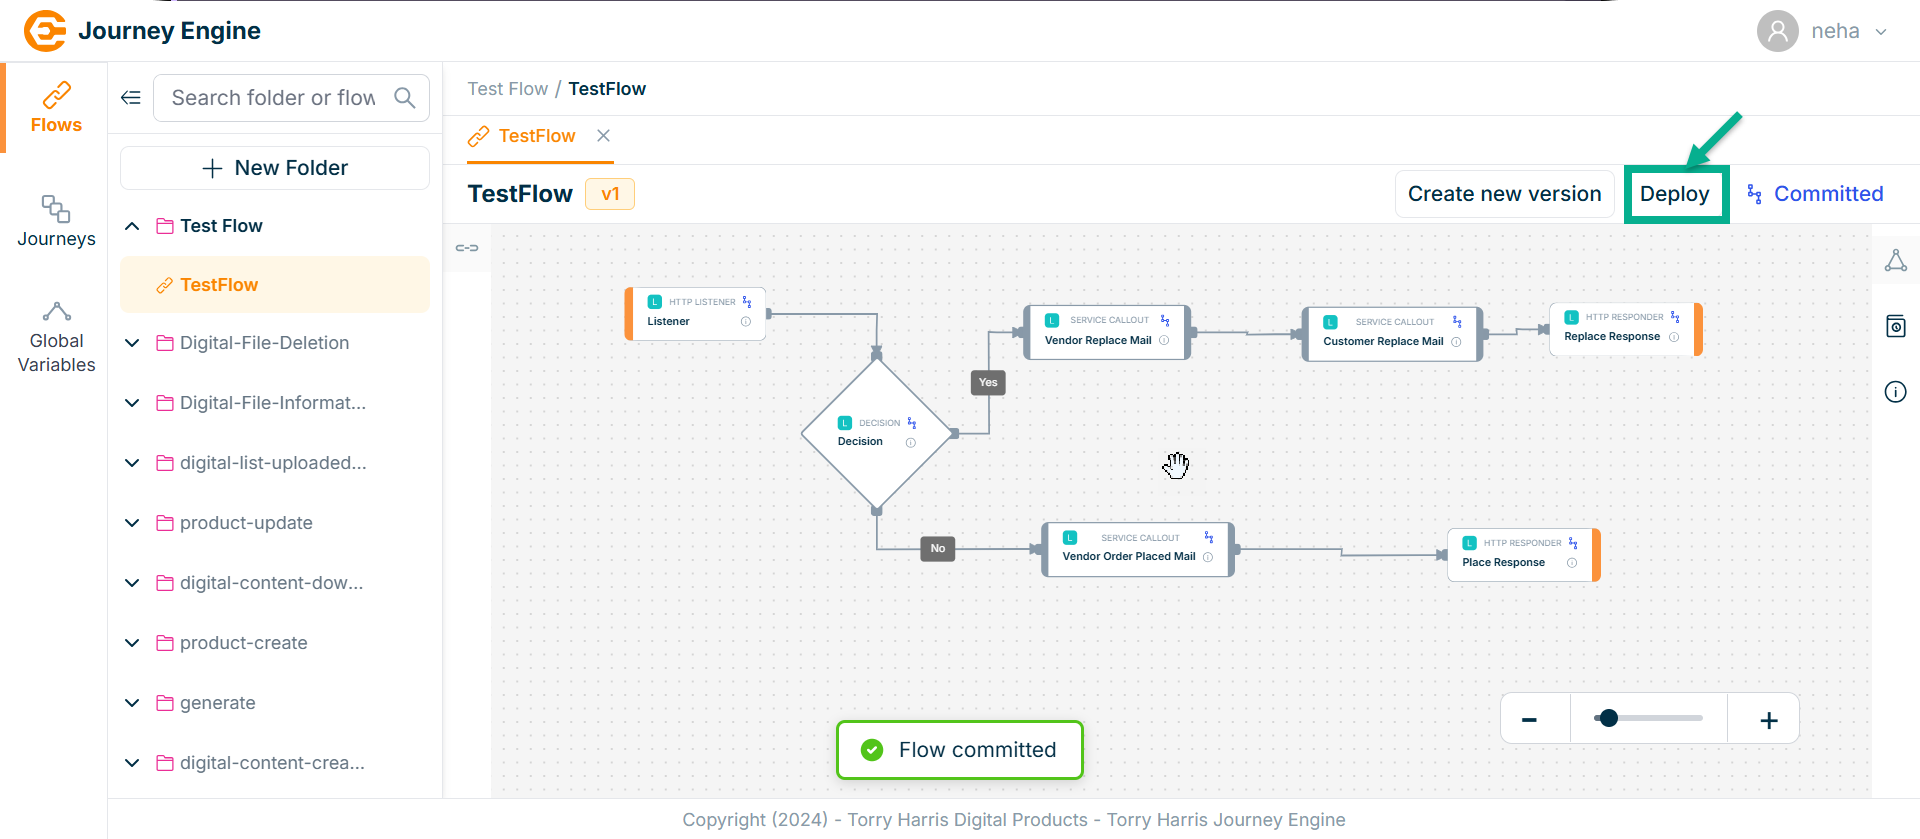
Deploy the Flow
- Click on Deploy.
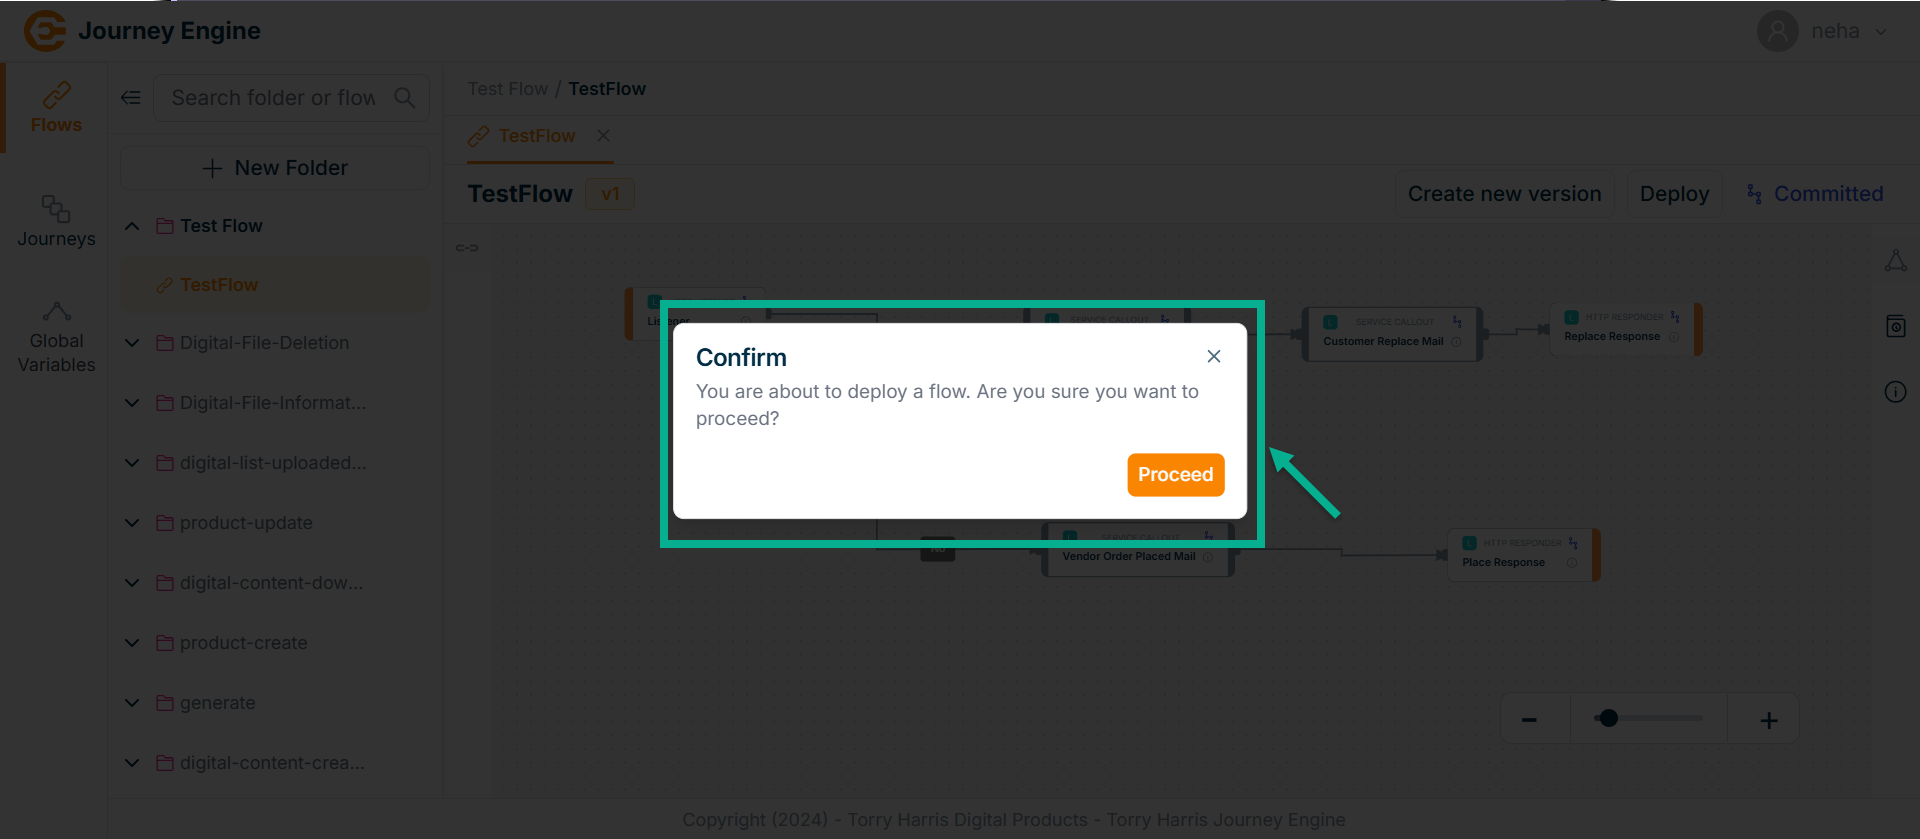
On deploying, confirm popup appear as shown below.
- Click on Proceed.
On proceeding, the confirmation message appears as shown below.
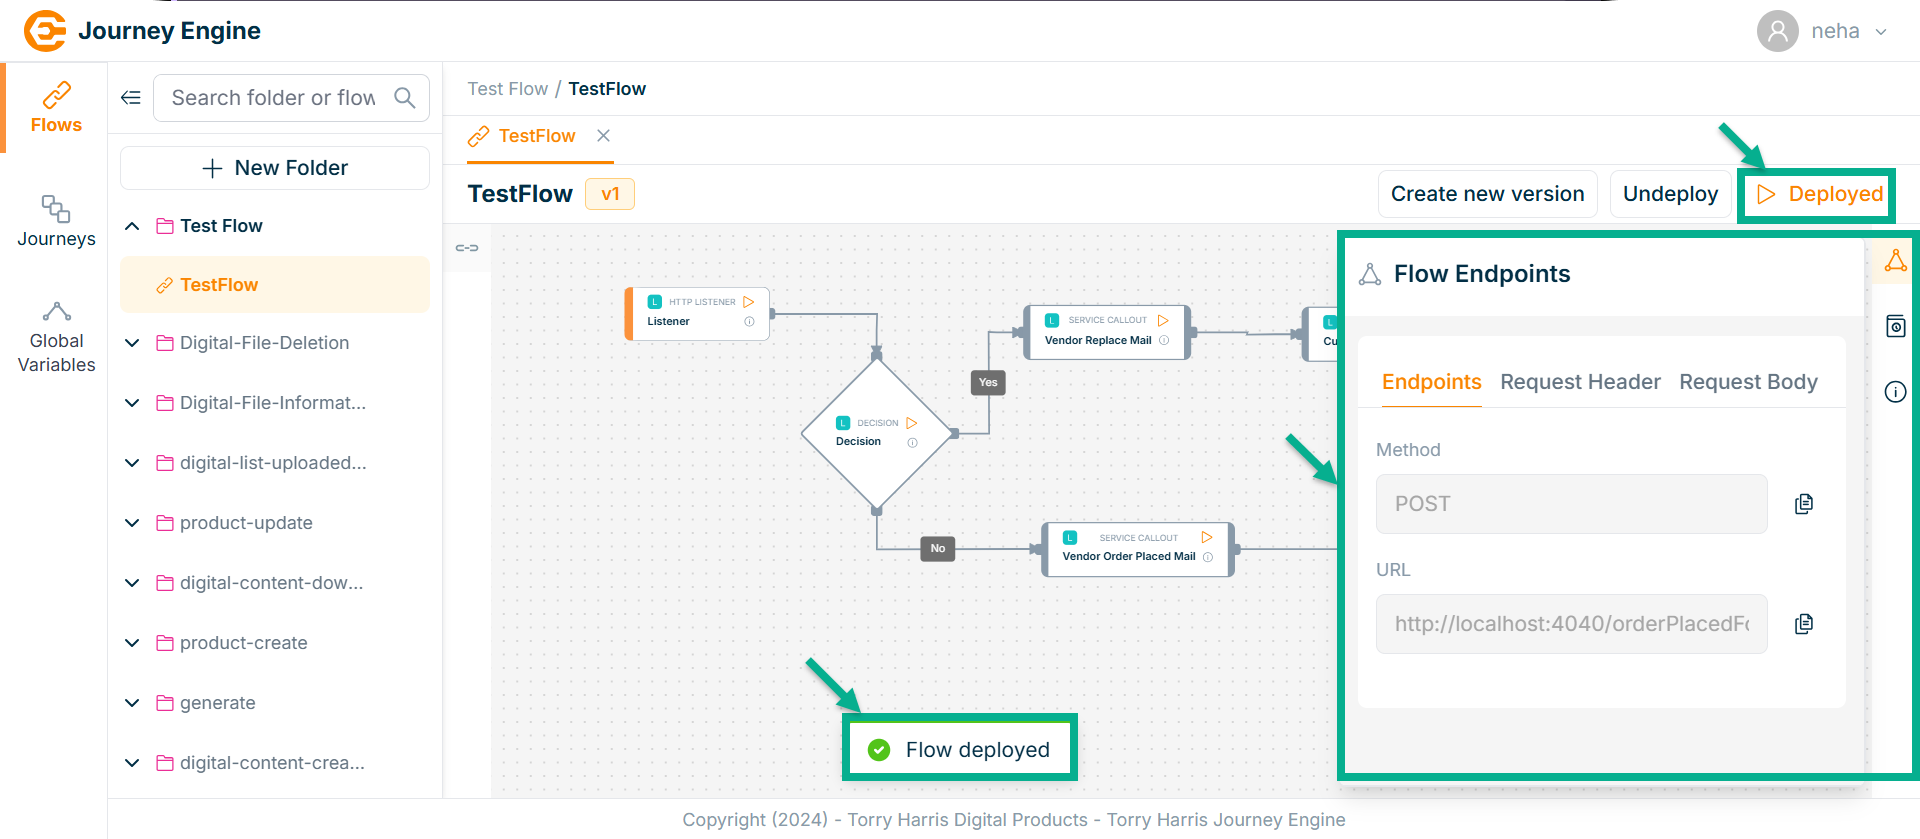
To test the API output, use the Postman tool, and copy the required data from the Flow Endpoints section.
Undeploy the Flow
- Click on Undeploy.
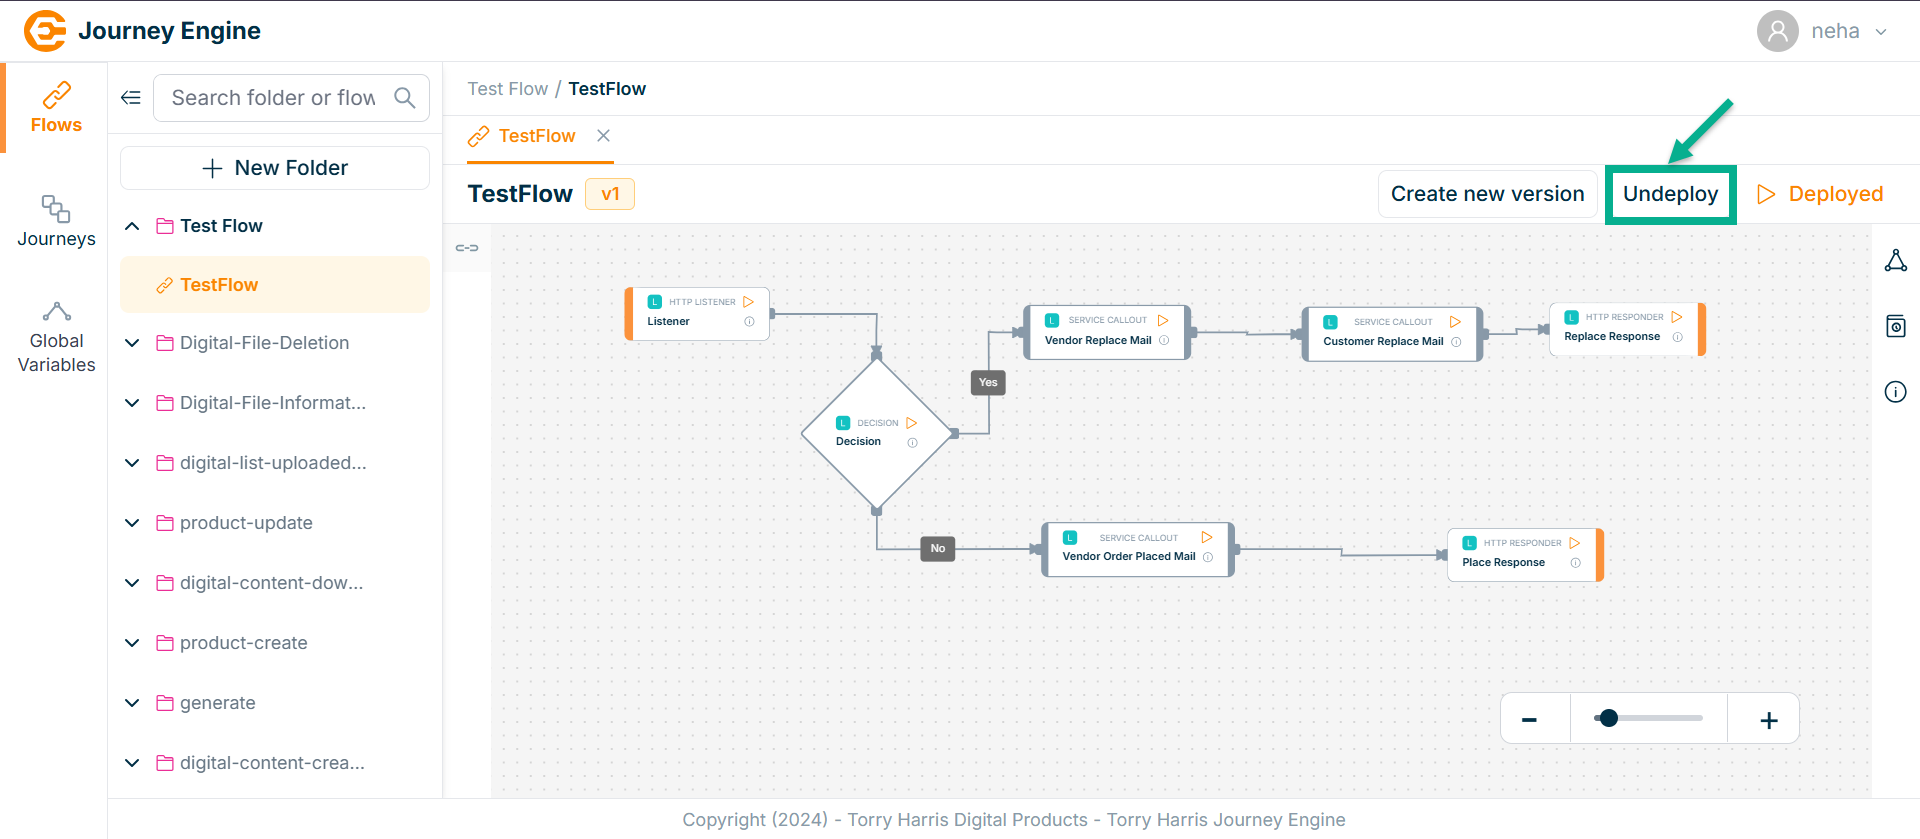
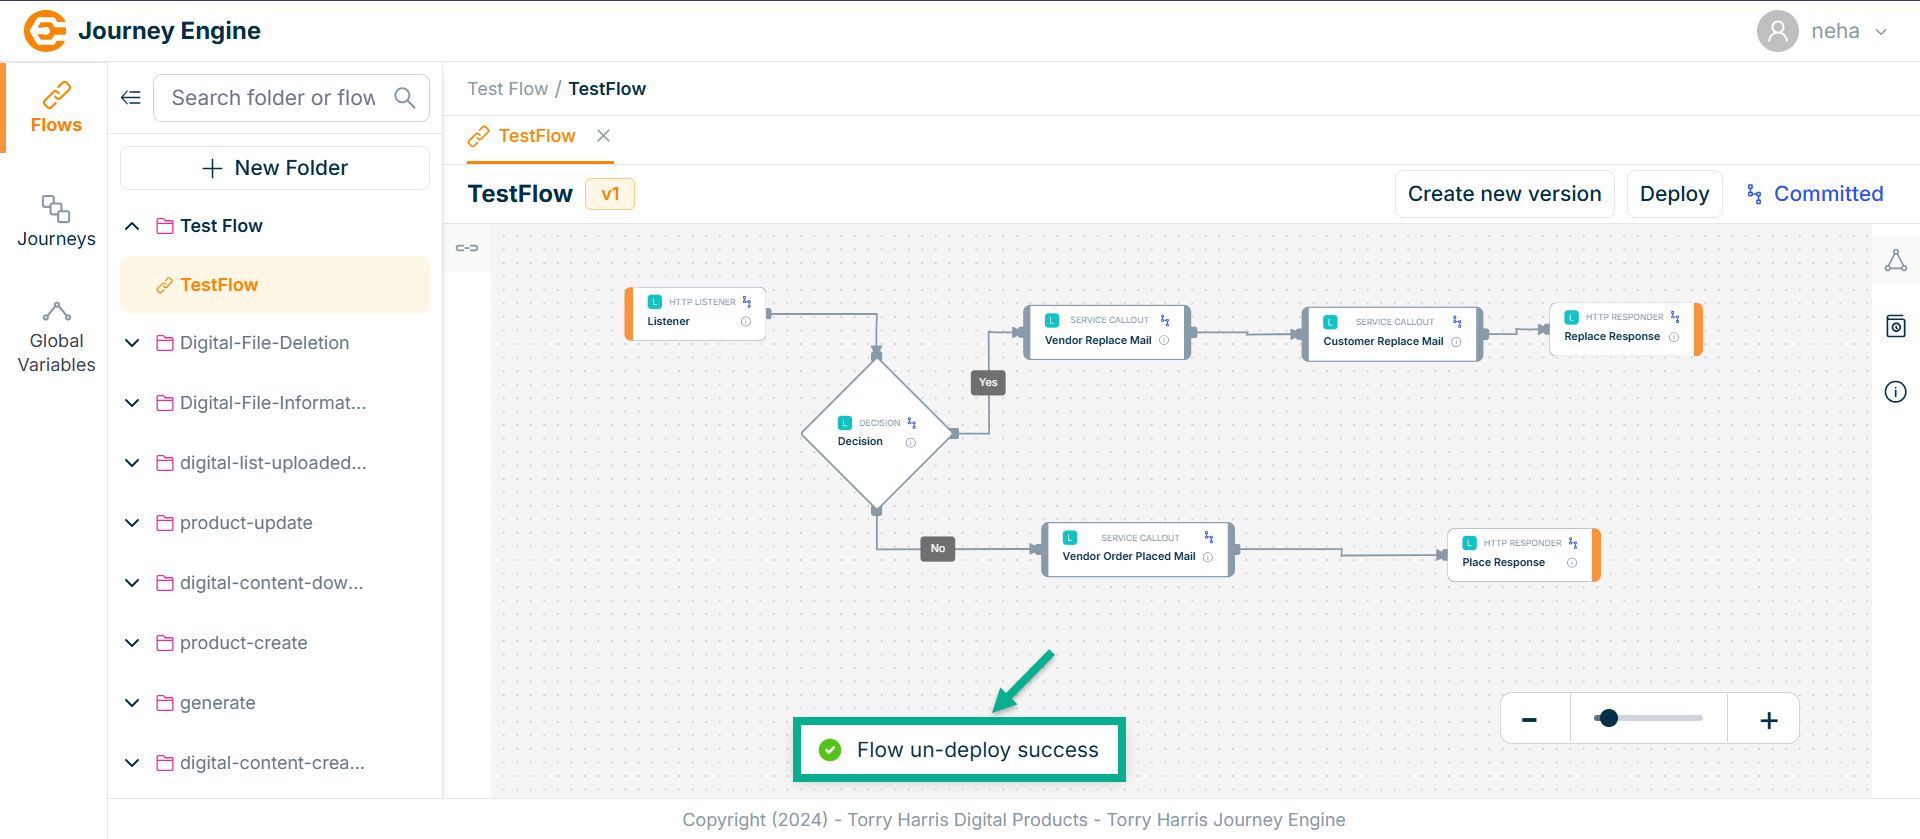
On undeploying, the confirmation message appears as shown below.
Create New Version for Flow
- Click on Create New Version.
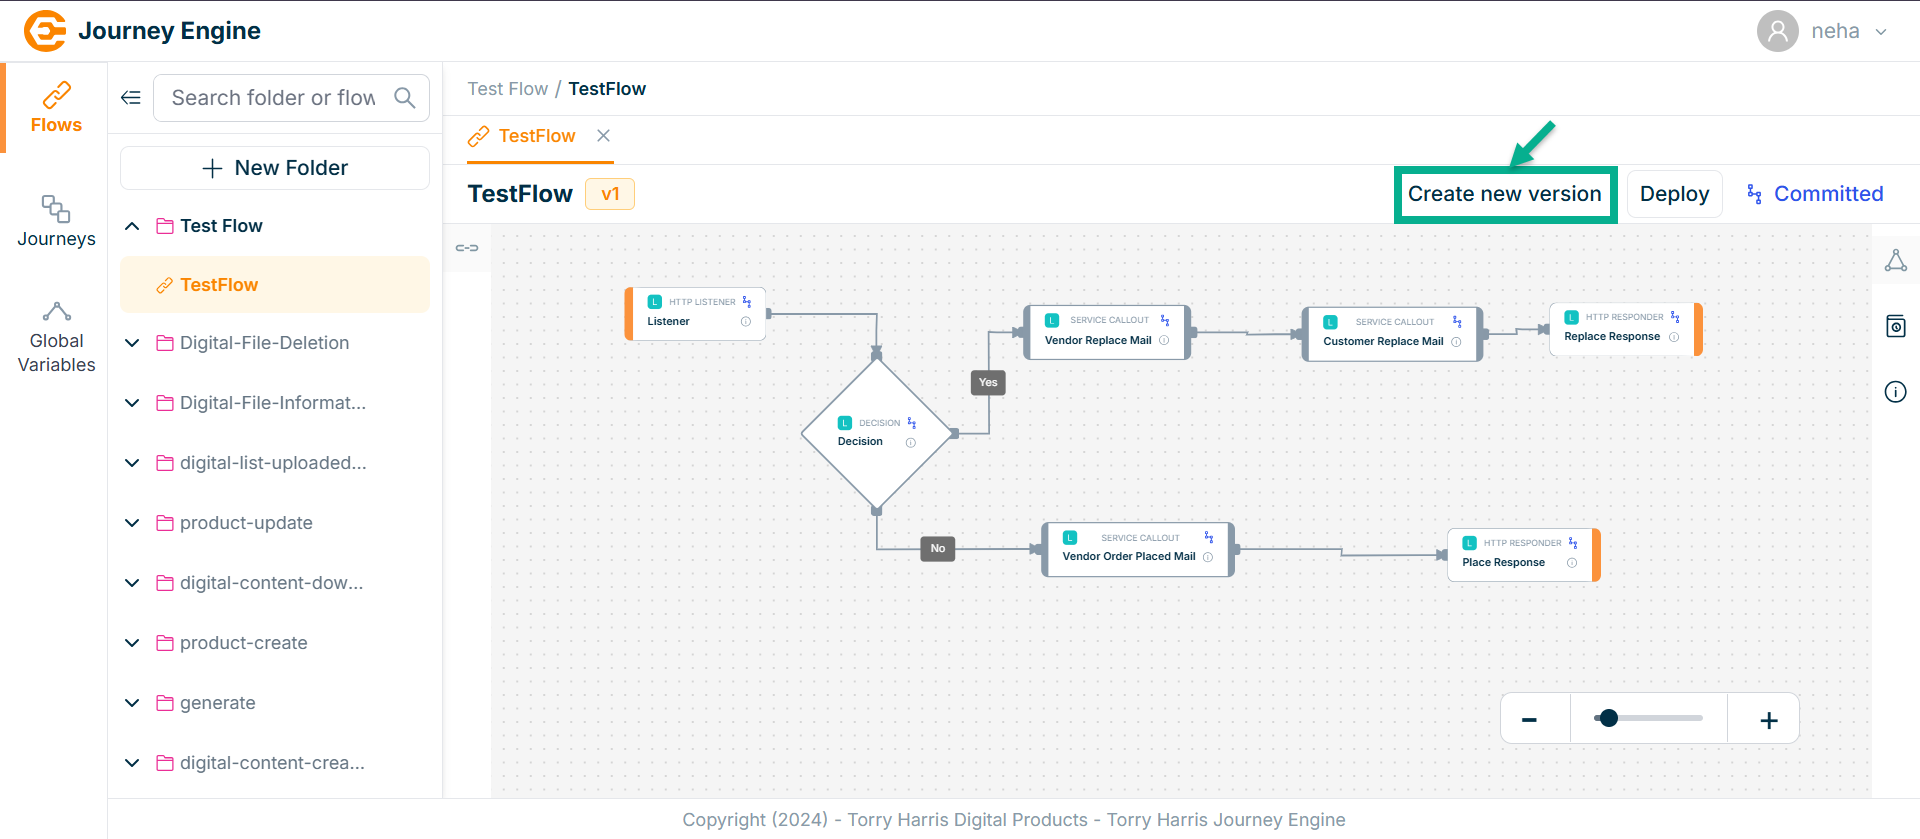
The Add Version popup screen apperas as shown below
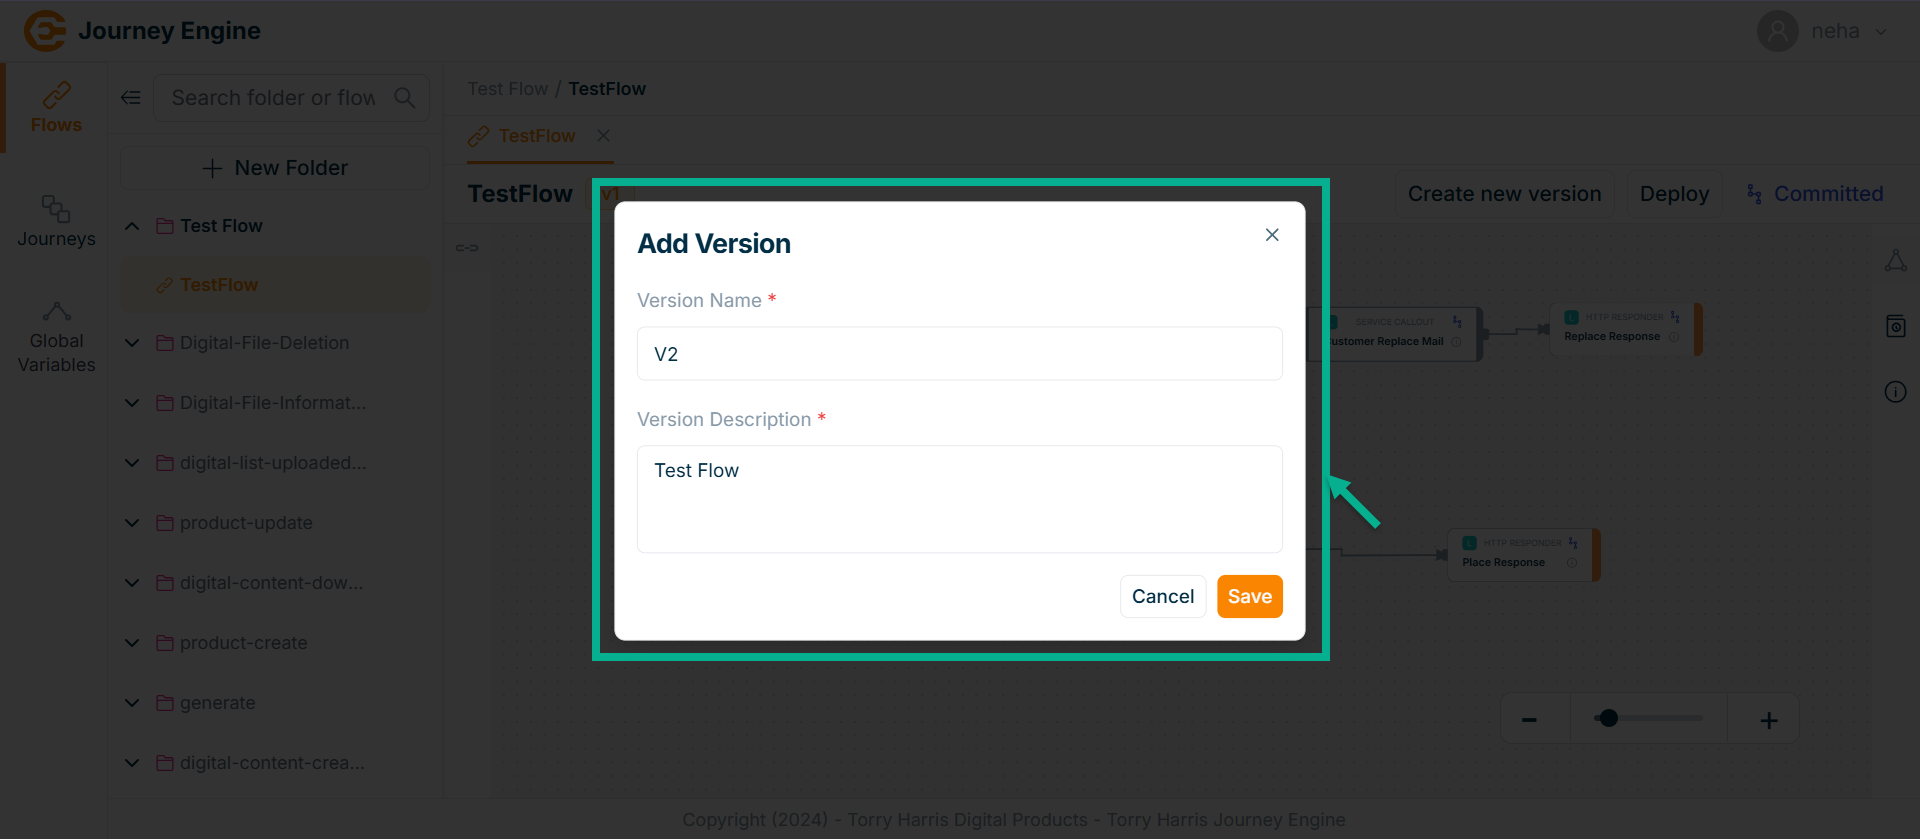
-
Enter Version Name and Version Description.
-
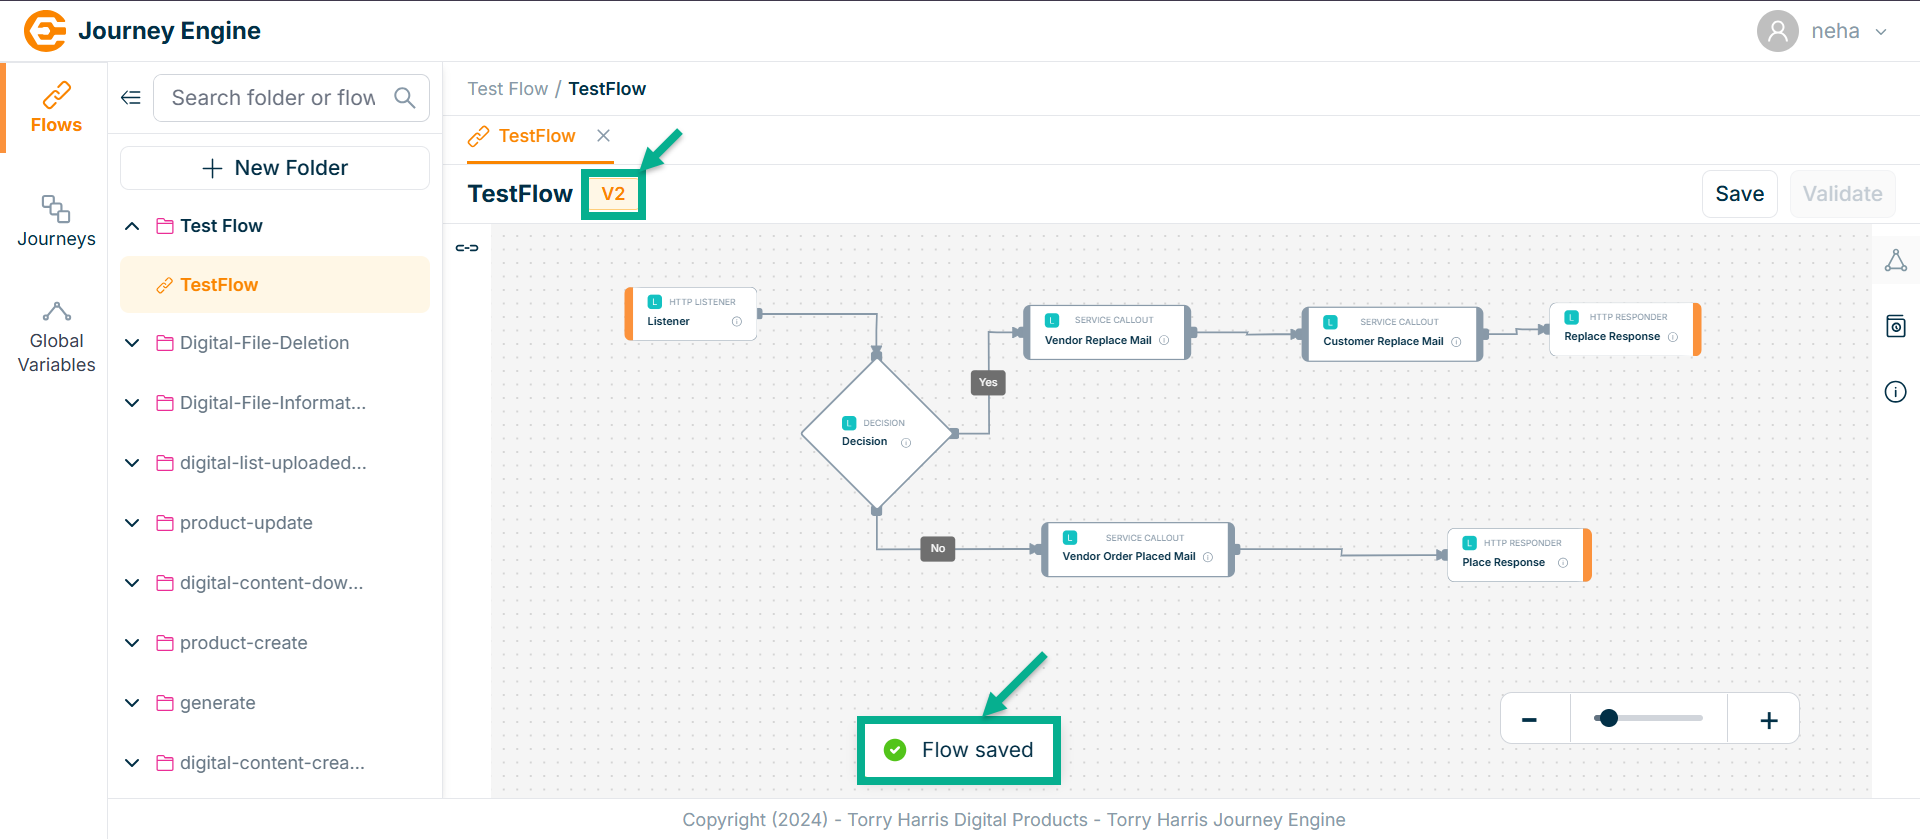
Click Save.
On saving, the confirmation message appears as shown below.
Only one version of a flow can be in the deployed state at a time. To deploy a different version, you must first undeploy the currently deployed one.